Fig. 5.
Download original image
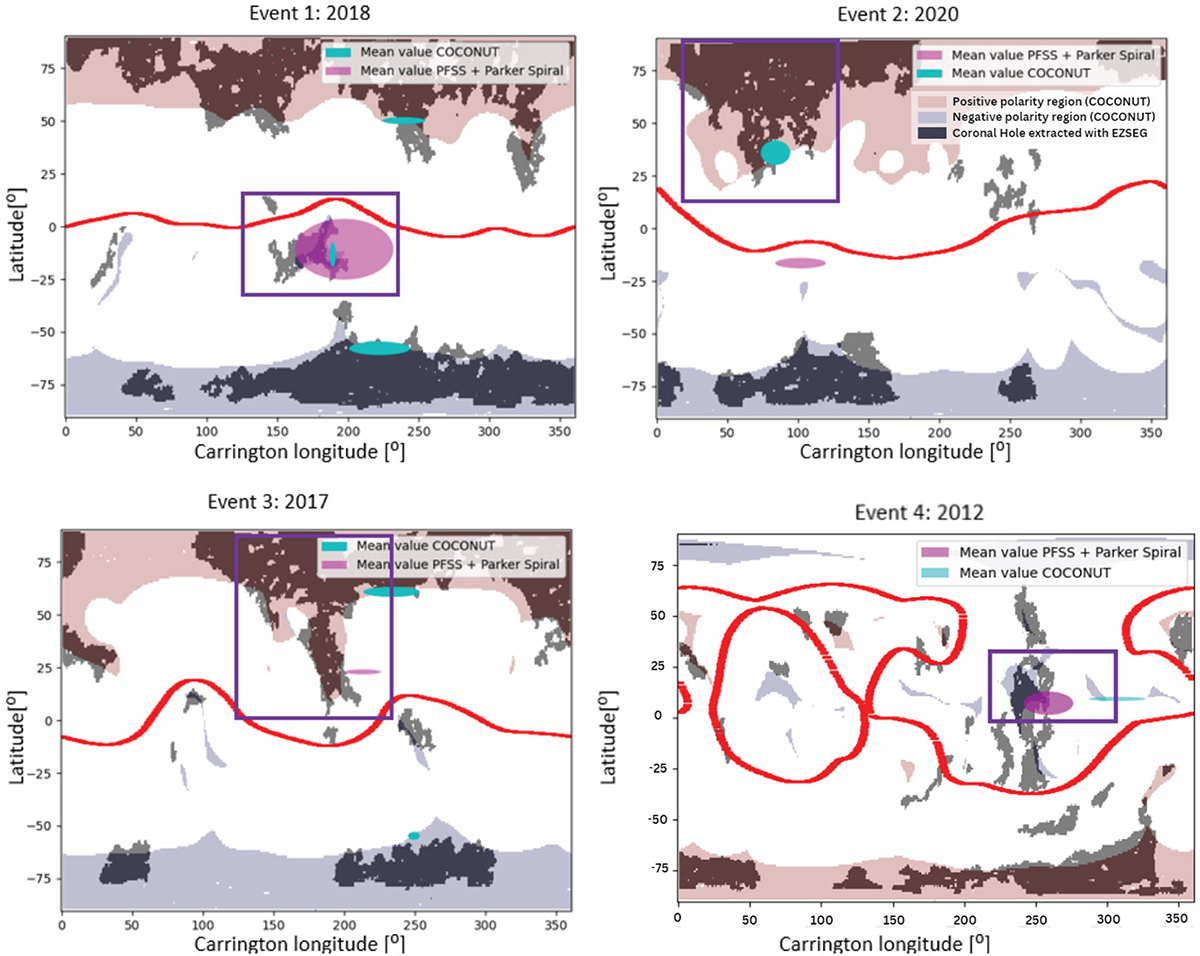
Validation of the MHD connectivity estimation for the four cases selected. We show the location at the surface of the Sun that is most likely to be connected to Earth during the corresponding HSS event. The MHD connectivity estimate is shown in bright blue, the two-step ballistic estimate is shown in pink, and the magnetic connectivity estimate from other studies (Reiss et al. 2021 for event 1 and Koukras et al. 2022 for other events) is shown with a purple rectangle. The area covered by the magnetic connectivity estimate represents the spatial and temporal uncertainties. We also show the HCS (red line) and CHs to explain these results better. The red and dark blue patches indicate respectively the positive and negative polarity regions of open magnetic field lines in the COCONUT simulation, while the gray areas indicate the CHs extracted from the SDO Carrington EUV maps using the EZSEG algorithm for events 1−3 (Caplan et al. 2016).
Current usage metrics show cumulative count of Article Views (full-text article views including HTML views, PDF and ePub downloads, according to the available data) and Abstracts Views on Vision4Press platform.
Data correspond to usage on the plateform after 2015. The current usage metrics is available 48-96 hours after online publication and is updated daily on week days.
Initial download of the metrics may take a while.