Fig. 4.
Download original image
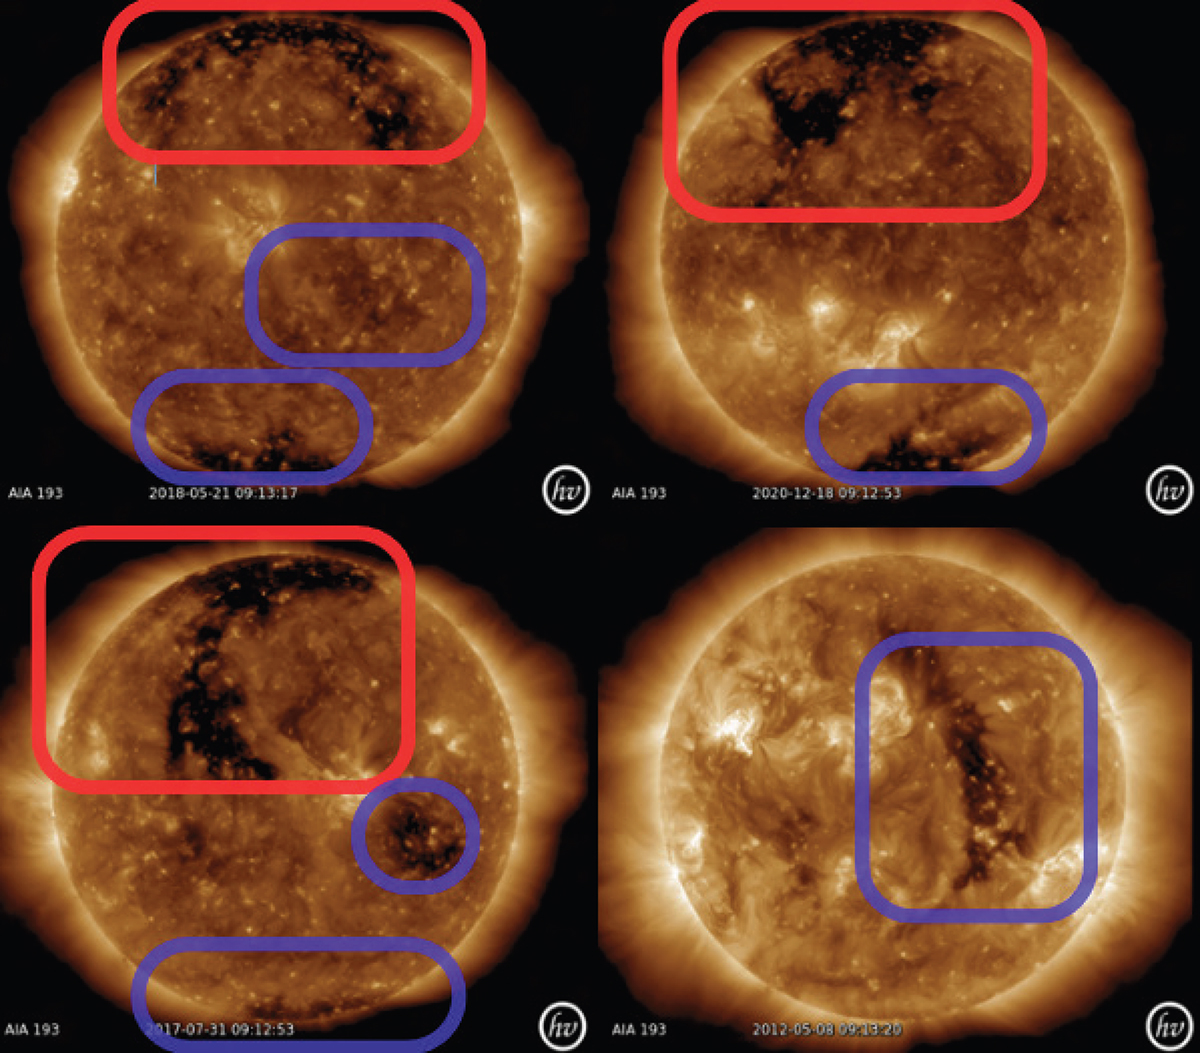
AIA (193 Å) images from SDO for events 1 to 4 (left to right, then top to bottom). The CHs are the darker regions visible and marked in the EUV wavelengths. The red and blue squares indicate the specific CH where a positive and negative polarity is expected, respectfully. The figures are made with Helioviewer (Helioviewer Project 2023). More information about the events can be found in Table 1.
Current usage metrics show cumulative count of Article Views (full-text article views including HTML views, PDF and ePub downloads, according to the available data) and Abstracts Views on Vision4Press platform.
Data correspond to usage on the plateform after 2015. The current usage metrics is available 48-96 hours after online publication and is updated daily on week days.
Initial download of the metrics may take a while.