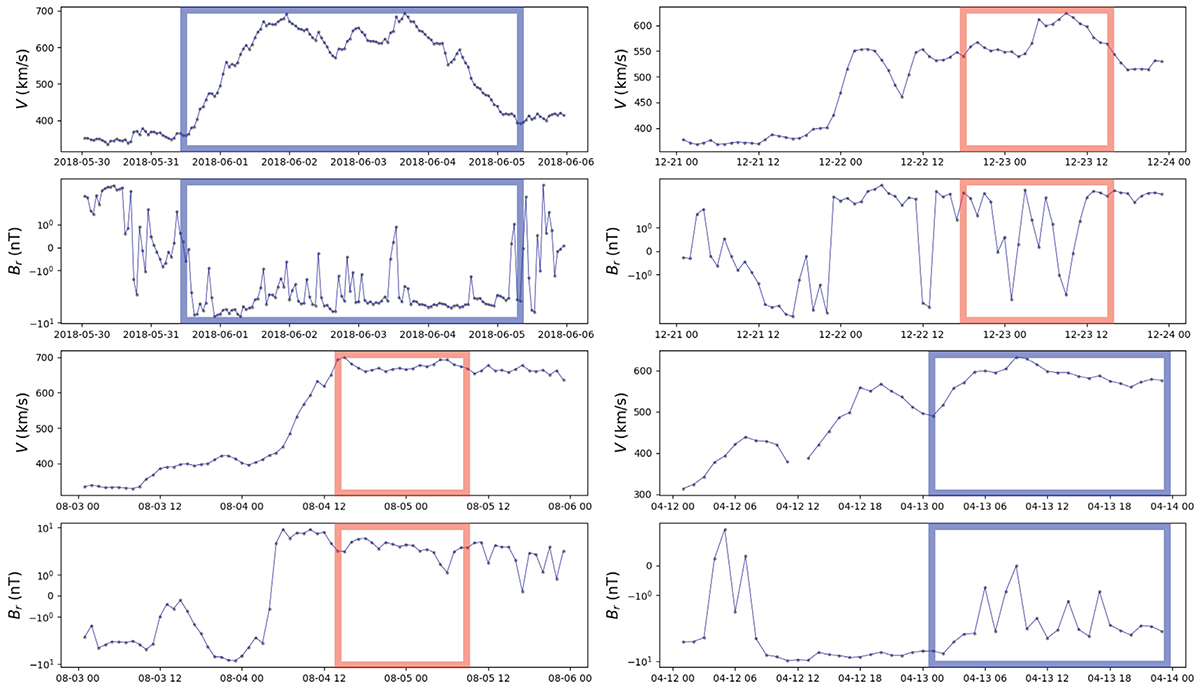
Fig. 3.
Download original image
In situ data for events 1 to 4 (left to right, then top to bottom). For each event, we show the mean velocity of the solar wind in km/s (top subpanel) and the radial magnetic field in nanoTesla (bottom subpanel). The ACE data, measured in situ, help us to identify the HSS corresponding to the CH event and indicate the polarity at Earth. The red and blue squares indicate the specific period of the event where a positive and negative polarity is expected, respectfully.
Current usage metrics show cumulative count of Article Views (full-text article views including HTML views, PDF and ePub downloads, according to the available data) and Abstracts Views on Vision4Press platform.
Data correspond to usage on the plateform after 2015. The current usage metrics is available 48-96 hours after online publication and is updated daily on week days.
Initial download of the metrics may take a while.