Fig. 9.
Download original image
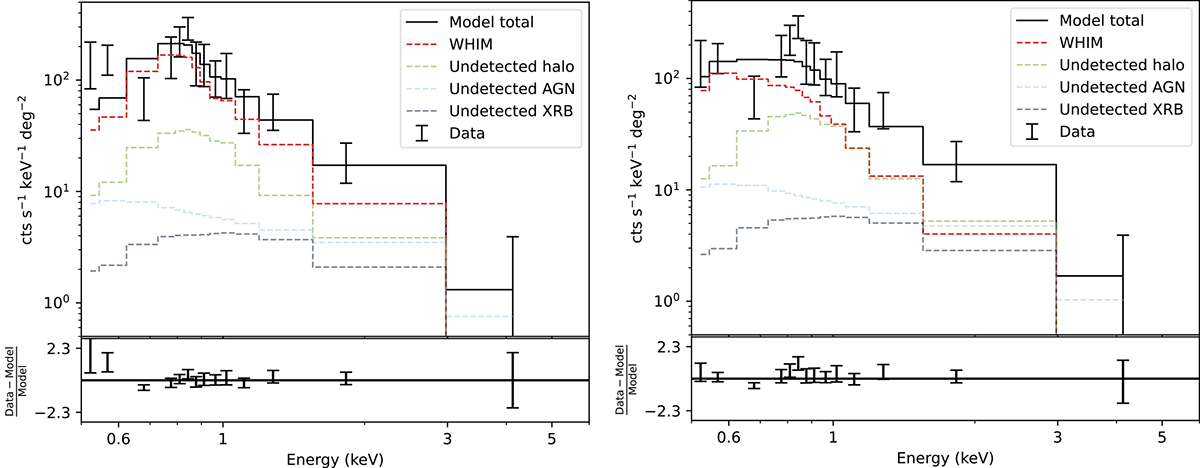
Rest frame stacked source spectrum of the 0–10 Mpc region from the filament spine in the transverse direction after the subtraction of the local background extracted in the 10–20 Mpc region surrounding the filament. For illustration, the spectrum is binned to a minimum signal-to-noise ratio of 2.5. The left panel shows that the combination of a single temperature CIE (red dashed line), and the unmasked sources models (green, blue, and grey) can well fit most of the spectrum, except the significant excess at E < 0.6 keV. The best-fit temperature of the WHIM gas is 0.58 ± 0.10 keV. The right panel shows a fitting by a log-normal temperature distribution with log(μ/K) = 5.9 and σ = 0.45 dex. The 0.5–0.6 keV energy range can be well fitted by this model, though there is a likely deficit at ∼0.7 keV.
Current usage metrics show cumulative count of Article Views (full-text article views including HTML views, PDF and ePub downloads, according to the available data) and Abstracts Views on Vision4Press platform.
Data correspond to usage on the plateform after 2015. The current usage metrics is available 48-96 hours after online publication and is updated daily on week days.
Initial download of the metrics may take a while.