Fig. 5.
Download original image
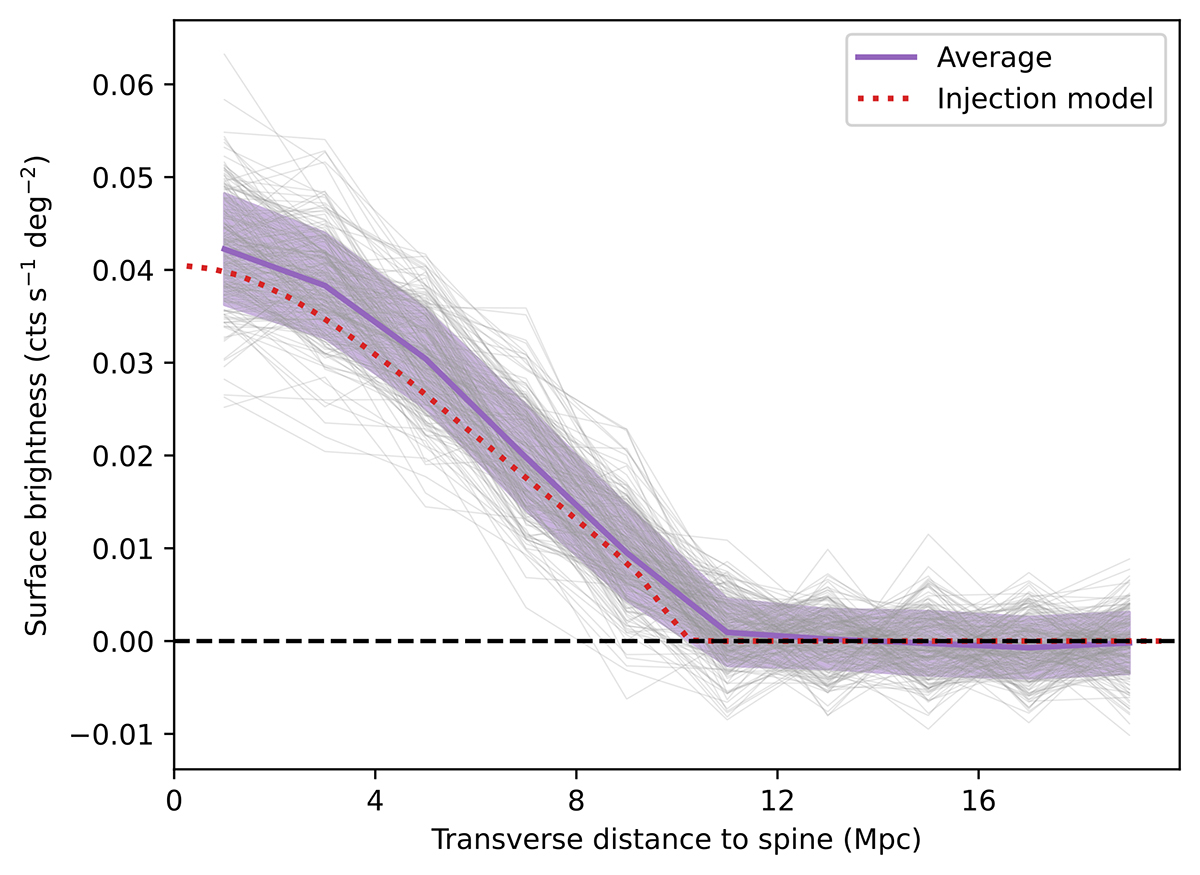
Results of 200 net surface brightness profiles of the simulated maps obtained by applying our stacking method (in gray). The red dashed curve is the injected surface brightness profile model. The curve in purple and the shaded region are the mean and standard deviation of the 200 profiles. Although the filament signal at the spine is only ∼0.5% of the background value, the stacking method can recover the injected profile successfully.
Current usage metrics show cumulative count of Article Views (full-text article views including HTML views, PDF and ePub downloads, according to the available data) and Abstracts Views on Vision4Press platform.
Data correspond to usage on the plateform after 2015. The current usage metrics is available 48-96 hours after online publication and is updated daily on week days.
Initial download of the metrics may take a while.