Fig. 3.
Download original image
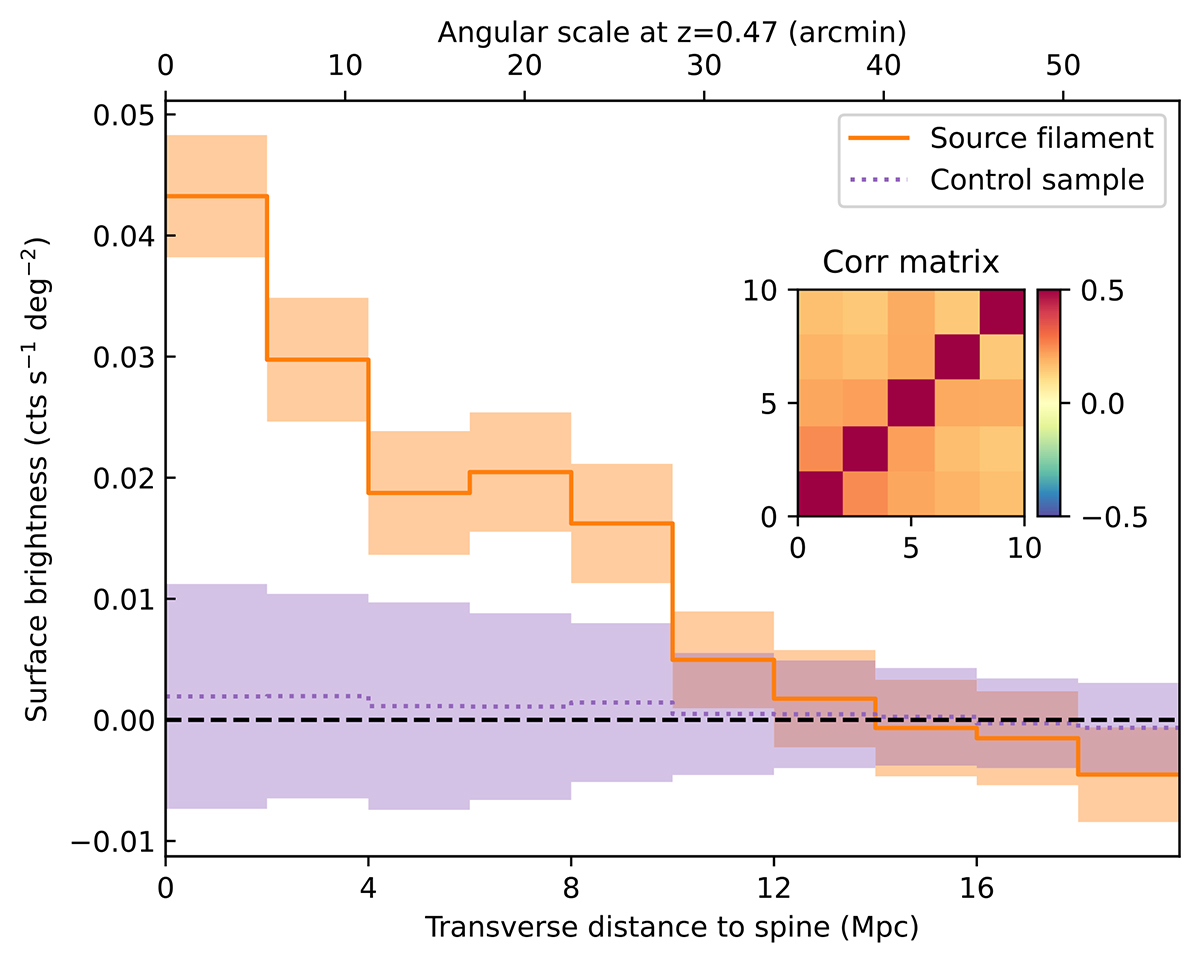
Stacked filament surface brightness profile in the 0.3–1.2 keV band at the observer’s frame. The X-axis is the transverse distance from the filament spine. The orange and purple lines and shaded regions denote the profiles of the source and the averaged value of the random-positioned control samples, respectively. The average surface brightness in the 10–20 Mpc transverse distance range is used as the local background and is subtracted from the profile to obtain the surface brightness signal of the net source profile. The shaded area of the source profile is the 1σ uncertainty estimated from a pixel-wise bootstrapping method, and that of the control samples is the 1σ scatter. The correlation matrix of the five bins in the 0–10 Mpc range is plotted in the inset figure.
Current usage metrics show cumulative count of Article Views (full-text article views including HTML views, PDF and ePub downloads, according to the available data) and Abstracts Views on Vision4Press platform.
Data correspond to usage on the plateform after 2015. The current usage metrics is available 48-96 hours after online publication and is updated daily on week days.
Initial download of the metrics may take a while.