Open Access
Fig. C.1.
Download original image
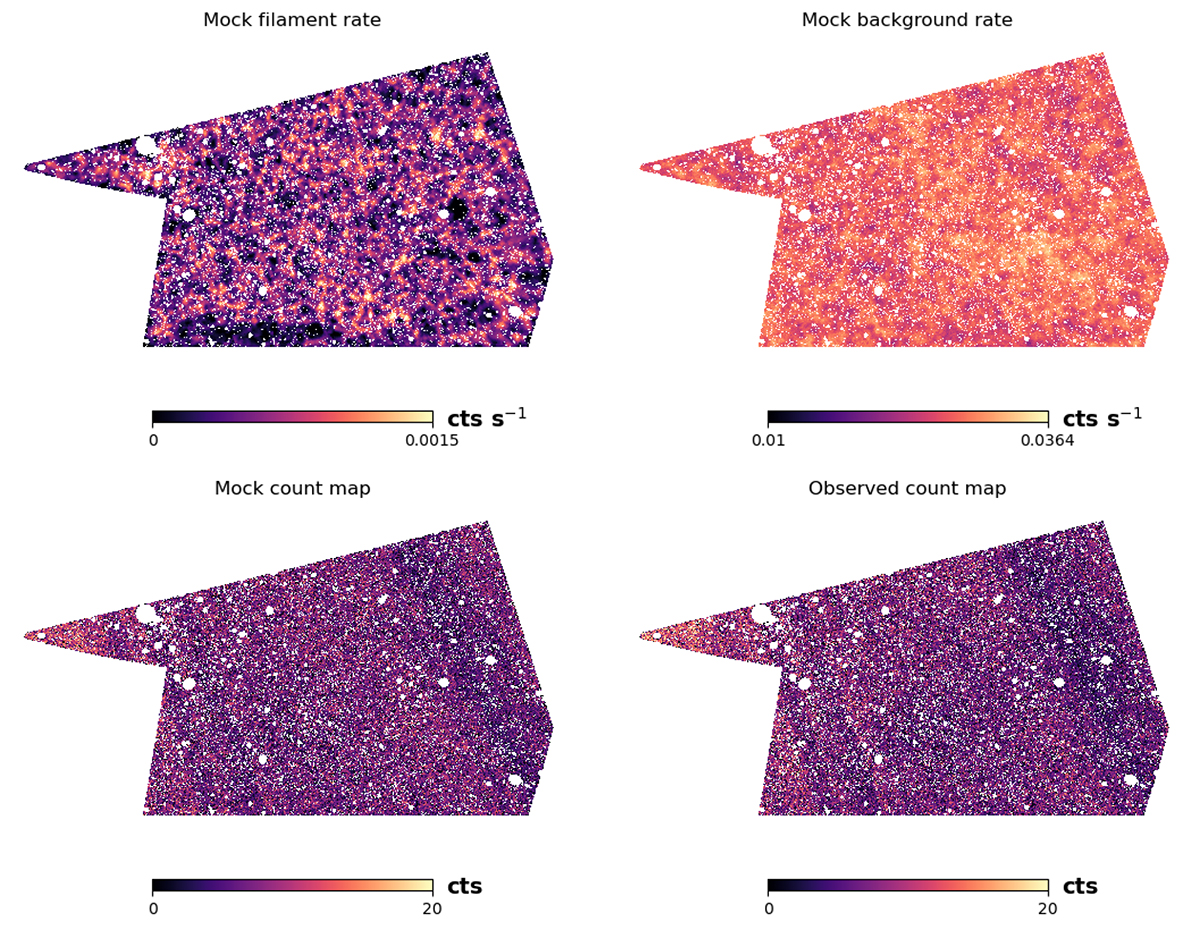
Example of simulated maps in the 0.3–1.2 keV band for validating the imaging stacking method. Top left: Mock count rate map for filament emission. Top right: Mock foreground/background emission mock map. Bottom left: Mock count map of the total emission. Bottom right: Observed count map as a comparison.
Current usage metrics show cumulative count of Article Views (full-text article views including HTML views, PDF and ePub downloads, according to the available data) and Abstracts Views on Vision4Press platform.
Data correspond to usage on the plateform after 2015. The current usage metrics is available 48-96 hours after online publication and is updated daily on week days.
Initial download of the metrics may take a while.