Fig. 3
Download original image
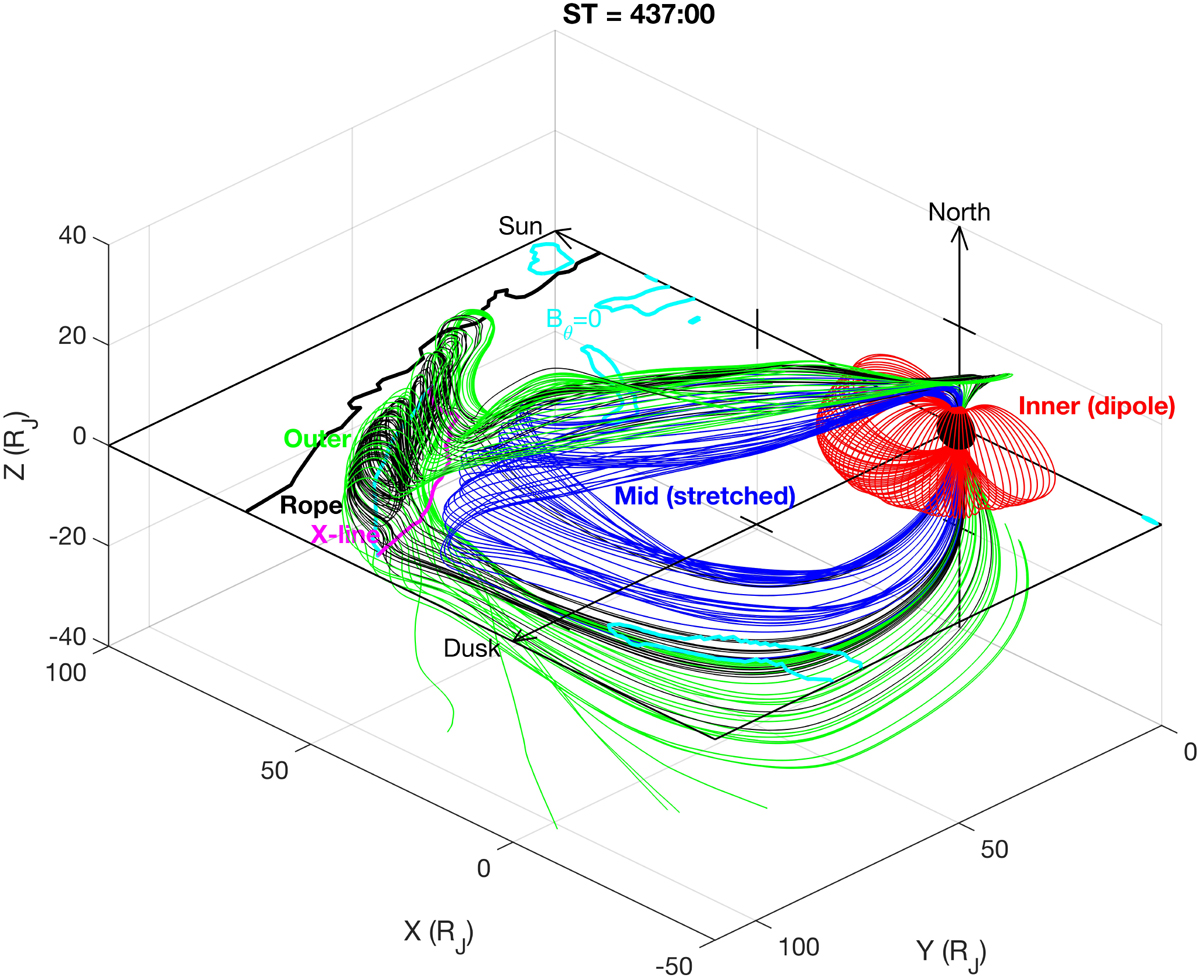
Jovian magnetospheric magnetic field lines near the dayside magnetodisc reconnection in the simulation. The blue, black, and green lines represent the stretched inner, flux rope, and outer magnetic fields passing through areas near the considered x-line (magenta line), respectively. The red lines denote the quasi-dipole fields in the inner magnetosphere. The Bθ zero lines at the equatorial plane are marked in cyan, and the considered x-line is marked in magenta. The equatorial bold black lines represent the magnetopause. The simulation time (ST) is 437 : 00.
Current usage metrics show cumulative count of Article Views (full-text article views including HTML views, PDF and ePub downloads, according to the available data) and Abstracts Views on Vision4Press platform.
Data correspond to usage on the plateform after 2015. The current usage metrics is available 48-96 hours after online publication and is updated daily on week days.
Initial download of the metrics may take a while.