Fig. 6.
Download original image
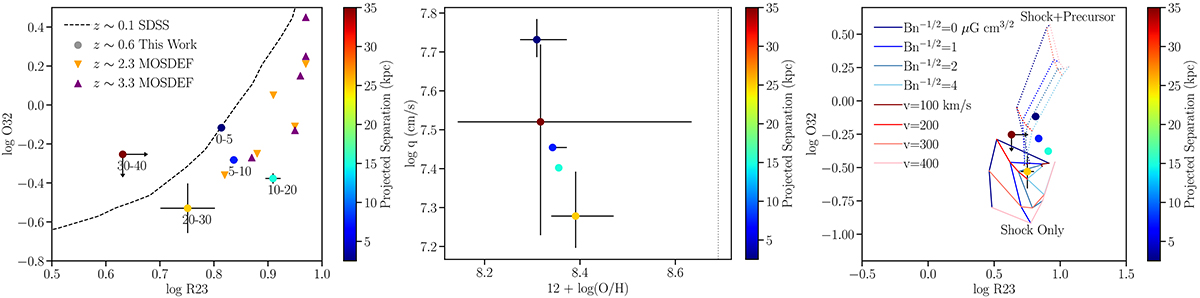
Stacked line ratios around galaxies. Left: O32 versus R23 diagram. The line ratios estimated from the stacked spectra (Fig. 2) are shown as circles that are color-coded by the average projected separation from the galaxy center. The annular bins (in kpc) corresponding to the ratios are also labeled next to each circle. Arrows denote 2σ limits on the line ratios. The median value of the line ratios of z ≈ 0.1 galaxies from SDSS is shown as the dashed black line. Line ratios from composite spectra of galaxies in the MOSDEF survey (Sanders et al. 2021) are shown as downward orange triangles for the z ≈ 2.3 sample and as purple upward triangles for the z ≈ 3.3 sample. Center: Ionization parameter versus metallicity (symbols are same as in the left panel) estimated from the emission line fluxes in the stacked spectra and photoionization models using the code IZI. The solar metallicity is demarcated by the dotted line. Right: O23 versus R23 diagram of the stacked sample (symbols are same as in the left panel) compared with results from the “shock only” (solid lines) and “shock+precursor” models (dotted lines) from Allen et al. (2008). Shock models are shown for several magnetic parameters and shock velocities, as denoted in the plot.
Current usage metrics show cumulative count of Article Views (full-text article views including HTML views, PDF and ePub downloads, according to the available data) and Abstracts Views on Vision4Press platform.
Data correspond to usage on the plateform after 2015. The current usage metrics is available 48-96 hours after online publication and is updated daily on week days.
Initial download of the metrics may take a while.