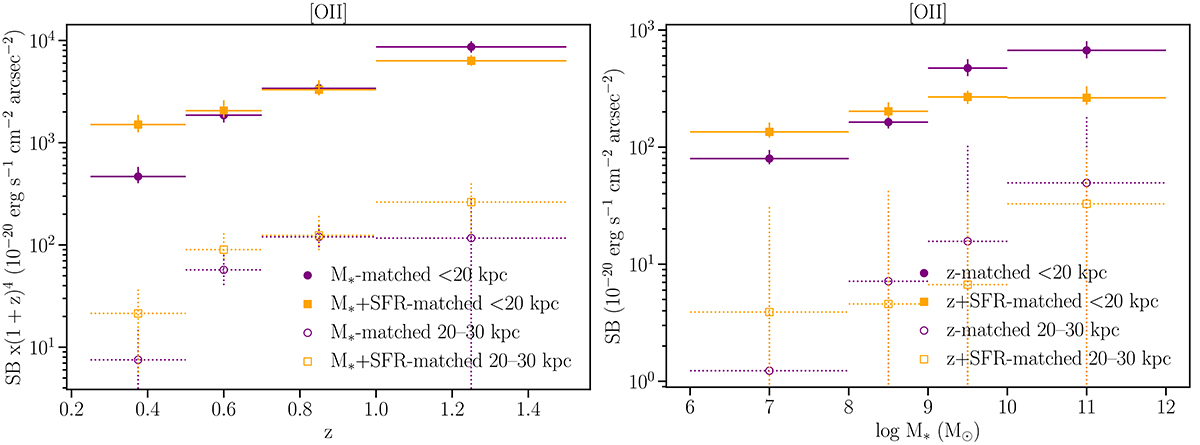
Fig. 5.
Download original image
Evolution of [O II] SB with redshift and stellar mass. Left: Average SB of [O II] emission, corrected for cosmological dimming, in four different redshift bins. The purple circles are for samples that are matched in stellar mass, whereas the orange squares are for samples that are matched in both stellar mass and SFR. Right: Average SB of [O II] emission in four different stellar mass bins. The purple circles are for samples that are matched in redshift, whereas the orange squares are for samples that are matched in both redshift and SFR. In both panels, the filled symbols represent the average values within a circular aperture of radius 20 kpc, and the open symbols the average values within an annular region between radii 20 and 30 kpc.
Current usage metrics show cumulative count of Article Views (full-text article views including HTML views, PDF and ePub downloads, according to the available data) and Abstracts Views on Vision4Press platform.
Data correspond to usage on the plateform after 2015. The current usage metrics is available 48-96 hours after online publication and is updated daily on week days.
Initial download of the metrics may take a while.