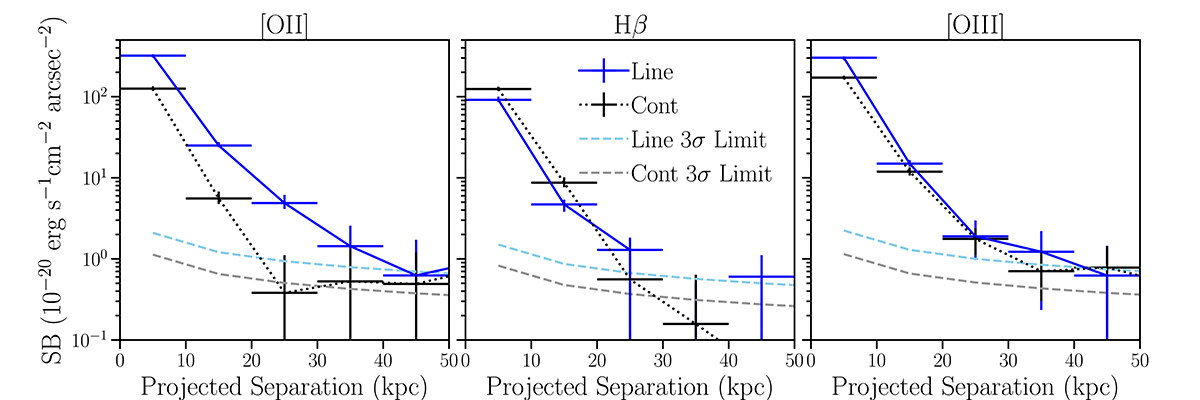
Fig. 4.
Download original image
SB of the median stacked sample as a function of projected separation from the galaxy center. The panels from left to right show the SB profiles of the [O II] (λ3727 + λ3729), Hβ, and [O III] (λ4960 + λ5008) emission. The SB is estimated as the azimuthally averaged value in annuli of radius 10 kpc from the pseudo-NB images shown in Fig. 3. In each panel, the solid blue line shows the SB profile of the line emission, the dotted black line shows the SB profile of the continuum emission near the line (averaged over two velocity windows with the same width as that of the line), the dashed light blue line shows the 3σ upper limit on the line SB, and the dashed gray line shows the 3σ upper limit on the continuum SB. The 16th and 84th percentiles of the SB profiles from bootstrapping analysis are shown as vertical bars. Note that the average image quality of the MUSE data is ≤5 kpc FWHM at z ≤ 1.
Current usage metrics show cumulative count of Article Views (full-text article views including HTML views, PDF and ePub downloads, according to the available data) and Abstracts Views on Vision4Press platform.
Data correspond to usage on the plateform after 2015. The current usage metrics is available 48-96 hours after online publication and is updated daily on week days.
Initial download of the metrics may take a while.