Fig. 2.
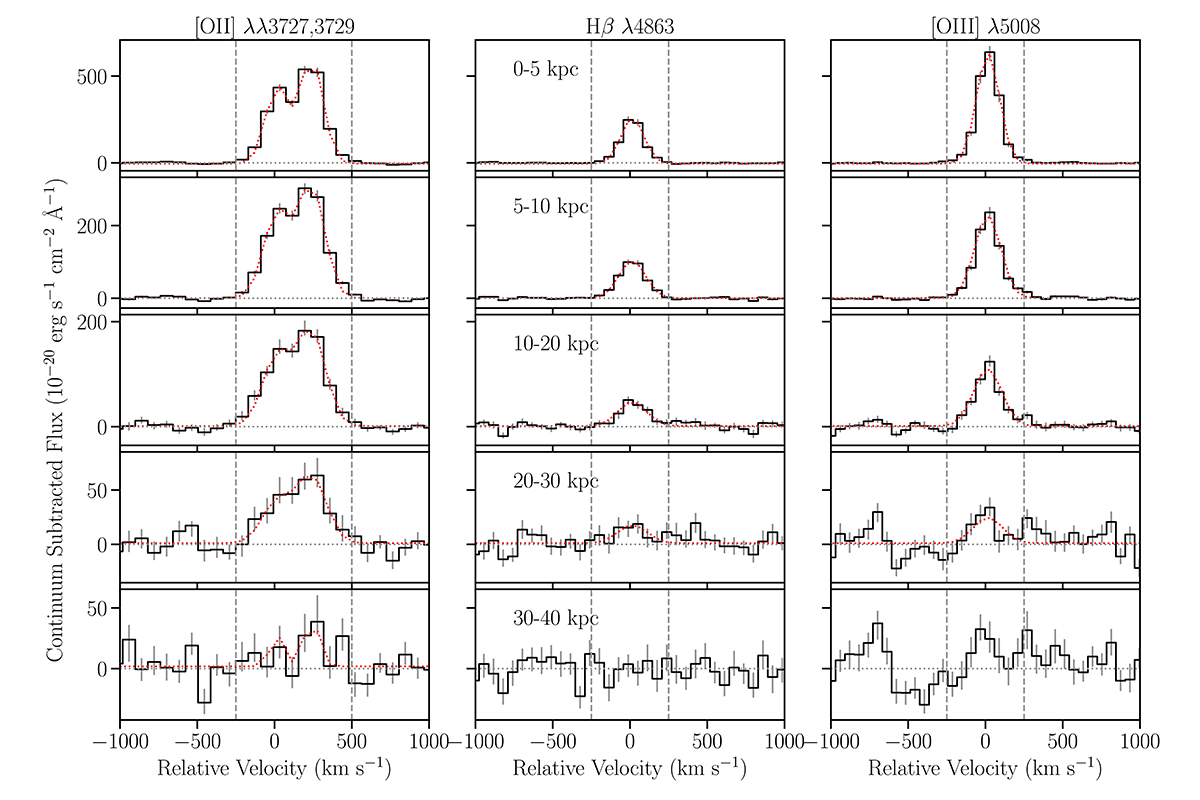
Download original image
Spectra of different emission lines (labeled at the top of each column) extracted from the median stacked cubes of the sample. From top to bottom, the spectra represent the total flux in annuli in radius ranges of 0–5 kpc, 5–10 kpc, 10–20 kpc, 20–30 kpc, and 30–40 kpc. The 16th and 84th percentiles of the spectra from bootstrapping analysis are shown as vertical bars. The Gaussian fits to the lines are shown as dotted red lines. The velocity windows used to construct the pseudo-NB images and SB profiles are marked with vertical dashed lines.
Current usage metrics show cumulative count of Article Views (full-text article views including HTML views, PDF and ePub downloads, according to the available data) and Abstracts Views on Vision4Press platform.
Data correspond to usage on the plateform after 2015. The current usage metrics is available 48-96 hours after online publication and is updated daily on week days.
Initial download of the metrics may take a while.