Fig. 9.
Download original image
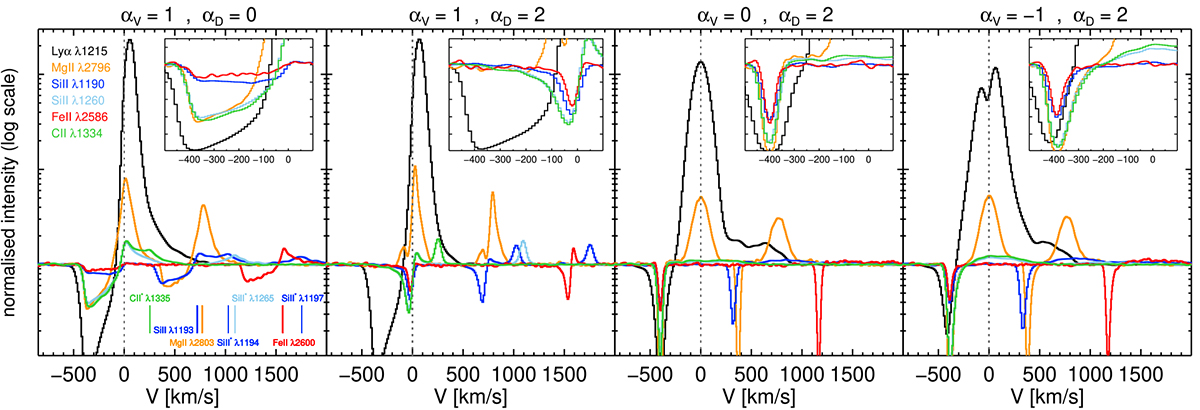
Relative variation of Lyα and metal line spectra for various values of αV and αD. The x-axis shows the frequency in velocity units where the zero point is set at the resonance of the line (for doublets, the line with the shortest wavelength is used) and denoted by a dotted grey line. Note that the normalised intensity in the main panels is in log scale to highlight both emission and absorption features. In each panel, the inset zooms on the absorption region on the blue side of the resonance (y-axis now in linear scale). The values for the fixed wind parameters are Vmax = 400 km s−1, b = 20 km s−1, and τd = 0. For Lyα, the H I column density is NHI = 1018 cm−2. The Mg+, Fe+, Si+ column densities are fixed to N = 1014 cm−2 whereas we take N = 1015 cm−2 for C+, owing to the fact that carbon is roughly ten times more abundant than the other elements according to solar values.
Current usage metrics show cumulative count of Article Views (full-text article views including HTML views, PDF and ePub downloads, according to the available data) and Abstracts Views on Vision4Press platform.
Data correspond to usage on the plateform after 2015. The current usage metrics is available 48-96 hours after online publication and is updated daily on week days.
Initial download of the metrics may take a while.