Fig. 3.
Download original image
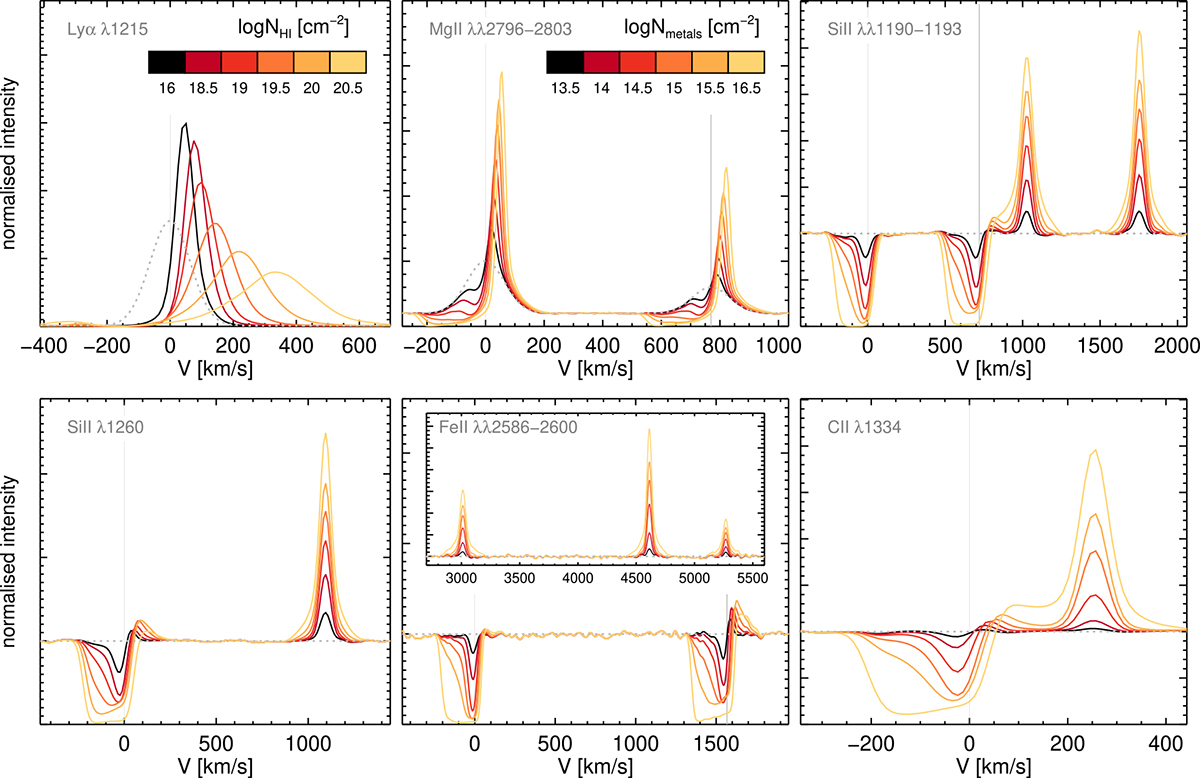
Variation of the integrated line profiles as a function of the column density, N. Each panel corresponds to one particular line or multiplet, i.e. H I Lyαλ1216, Mg IIλλ2796, 2803, Si IIλλ1190, 1193, Si IIλ1260, Fe IIλλ2586,2600, and C IIλ1334. All lines have been normalised to the continuum intensity. Dotted grey lines depict the input emission and vertical lines show the location of the resonances. On the x-axis, frequencies are expressed in terms of velocity offset relative to the resonant wavelength λ0 (the bluest line is used in case of multiplets), namely ![]() . For Fe II, the inset shows the fluorescent lines associated with Fe IIλλ2586,2600 which are emitted at much longer wavelengths (see Table 1).
. For Fe II, the inset shows the fluorescent lines associated with Fe IIλλ2586,2600 which are emitted at much longer wavelengths (see Table 1).
Current usage metrics show cumulative count of Article Views (full-text article views including HTML views, PDF and ePub downloads, according to the available data) and Abstracts Views on Vision4Press platform.
Data correspond to usage on the plateform after 2015. The current usage metrics is available 48-96 hours after online publication and is updated daily on week days.
Initial download of the metrics may take a while.