Fig. 13.
Download original image
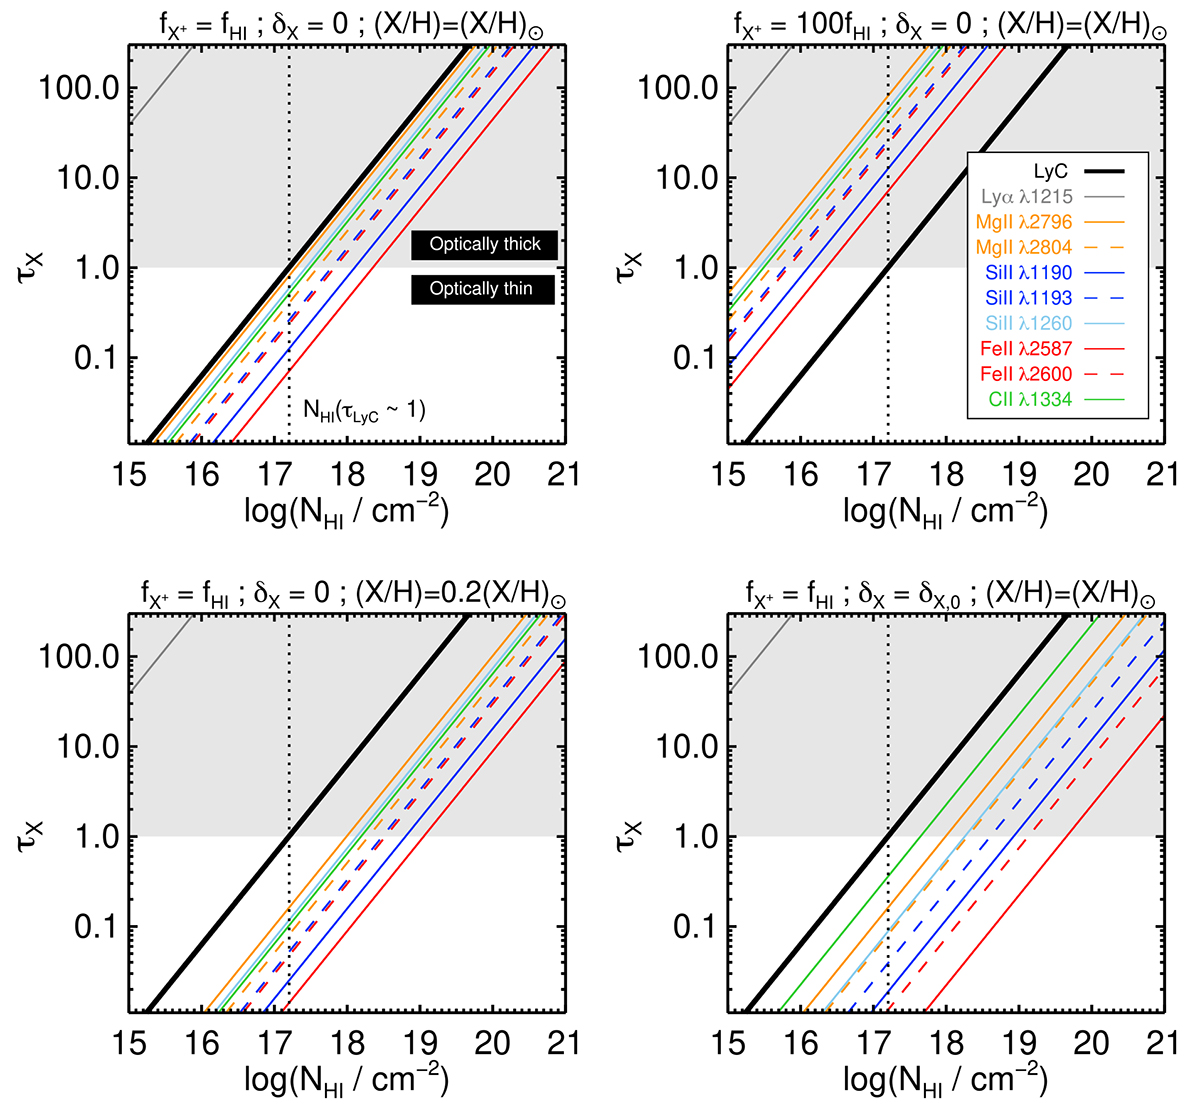
Comparison of the LyC opacity (thick black line) with the line centre opacities of each transition (thin coloured lines) considered in this study as a function of H I column density. The gas opacity of each line is estimated according to Eq. (6) and assumes solar abundances (X/H) = (X/H)⊙. Each panel corresponds to different sets of dust depletion δX, metallicity (X/H), and relative singly-ionised metal fraction to H I neutral fraction (fX+/fHI) values. δX, 0 is the dust depletion based on MW measurements (see text and Table 1). The ![]() = 1 horizontal line marks the transition between optically thin and thick regimes. The dotted vertical line depicts the Lyman limit (i.e. NHI = 1.6 × 1017 cm−2) below which ionising photons can efficiently escape the medium.
= 1 horizontal line marks the transition between optically thin and thick regimes. The dotted vertical line depicts the Lyman limit (i.e. NHI = 1.6 × 1017 cm−2) below which ionising photons can efficiently escape the medium.
Current usage metrics show cumulative count of Article Views (full-text article views including HTML views, PDF and ePub downloads, according to the available data) and Abstracts Views on Vision4Press platform.
Data correspond to usage on the plateform after 2015. The current usage metrics is available 48-96 hours after online publication and is updated daily on week days.
Initial download of the metrics may take a while.