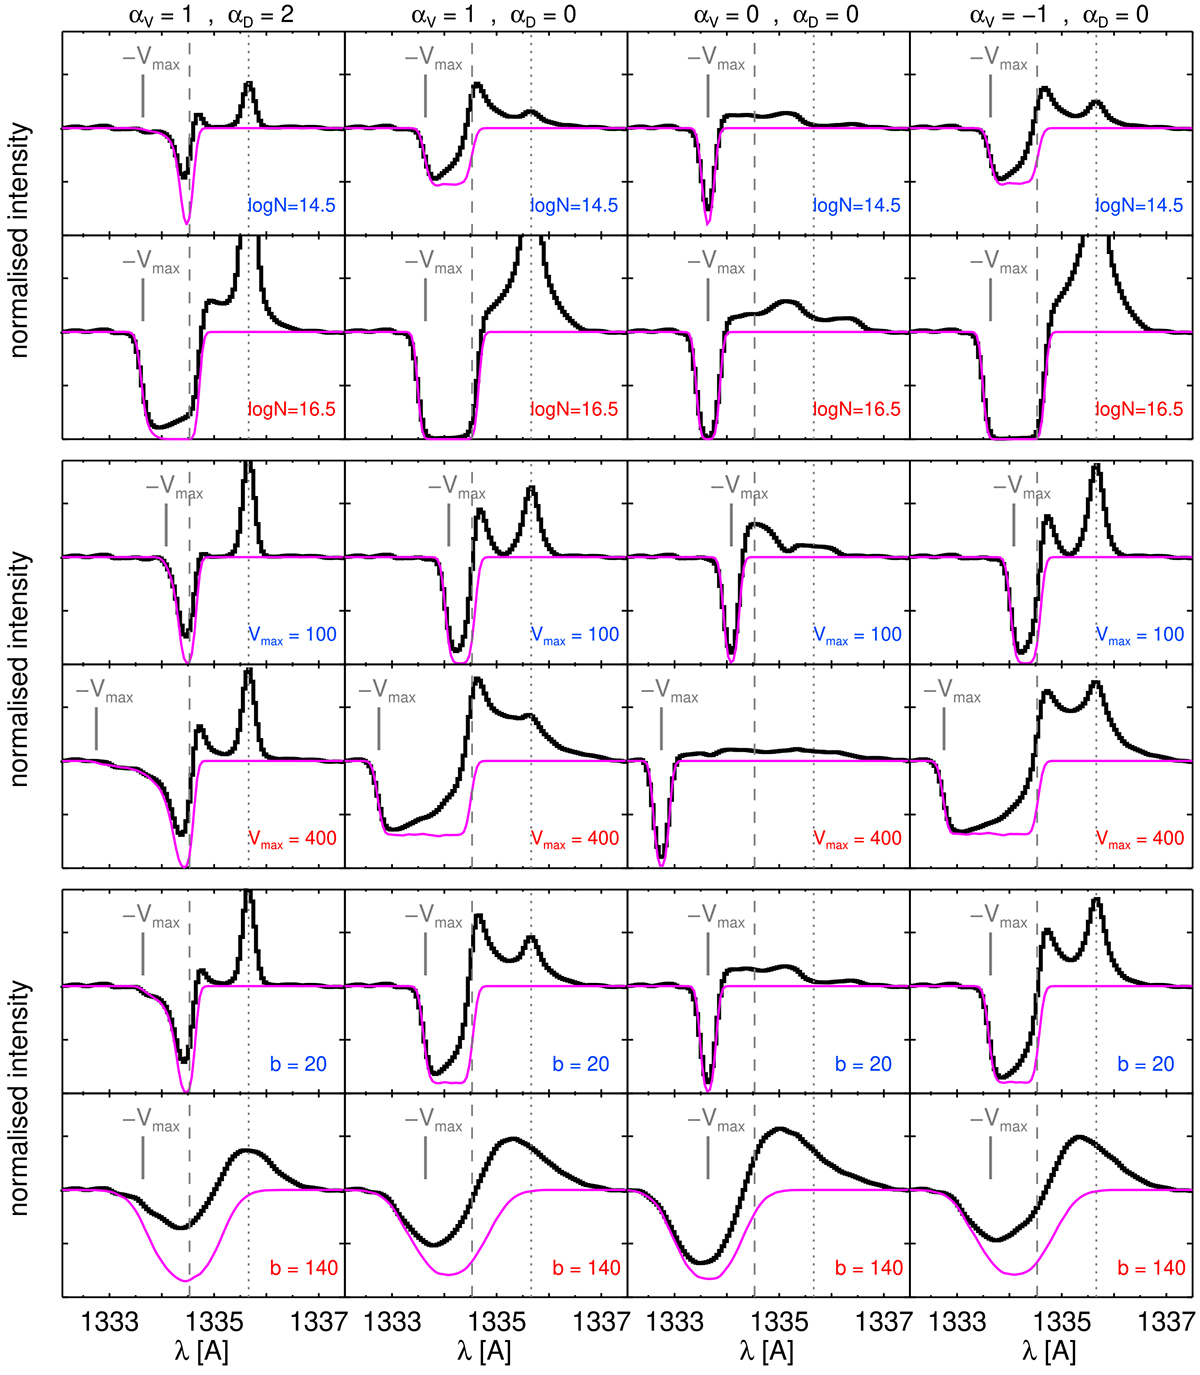
Fig. 11.
Download original image
Illustration of the impact of the wind parameters on line infilling. Black curves show C IIλ1334 spectra resulting from the RT simulations whereas magenta lines depict the true absorption profiles (i.e. ignoring re-emission). Columns correspond to various combinations of velocity and density gradients. In all spectra, the continuum is normalised to one. The top, middle, and bottom panels show the spectra for different values of the gas column density, maximum velocity and Doppler parameter respectively. In all cases, the non-varying parameters are fixed to the following fiducial values: log(N/cm−2) = 15, Vmax = 200 km s−1, b = 20 km s−1, τd = 0. Dashed (dotted) lines mark the wavelength of the C IIλ1334 resonance (C II*λ1335 fluorescence). Grey solid lines indicate the wavelength (in velocity units relatively to C IIλ1334) of photons that are seen at line centre by an element of outflowing gas at Vmax.
Current usage metrics show cumulative count of Article Views (full-text article views including HTML views, PDF and ePub downloads, according to the available data) and Abstracts Views on Vision4Press platform.
Data correspond to usage on the plateform after 2015. The current usage metrics is available 48-96 hours after online publication and is updated daily on week days.
Initial download of the metrics may take a while.