Fig. 10.
Download original image
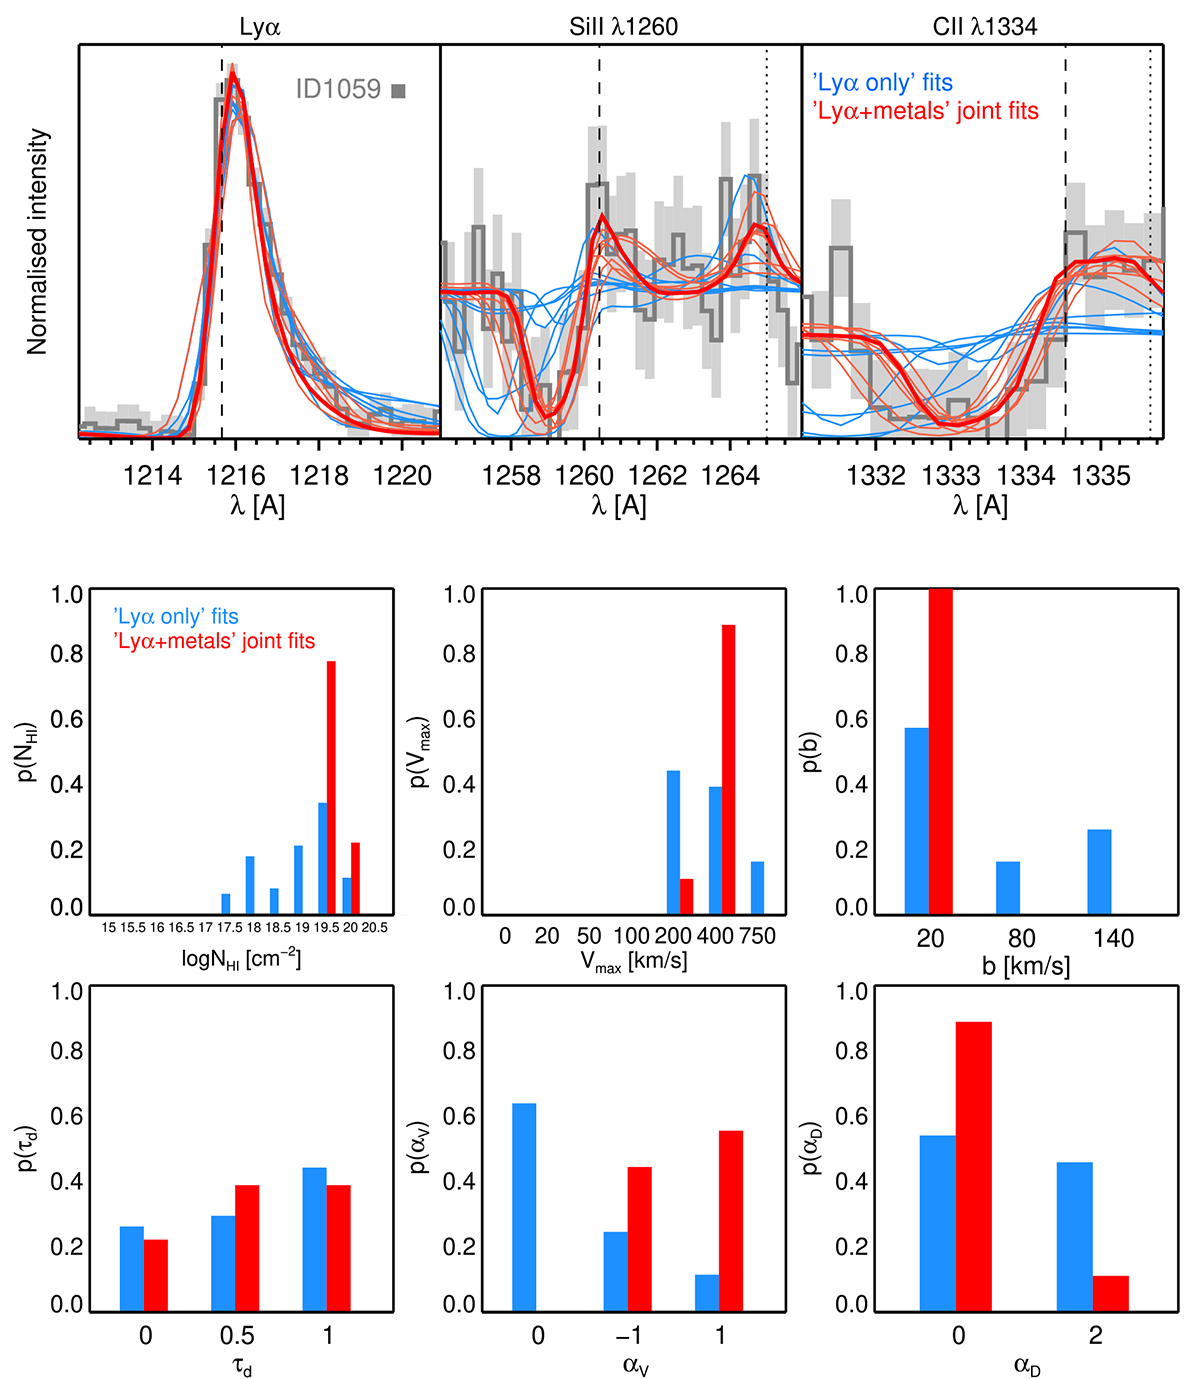
Fitting analysis of a MUSE LAE (ID1059) from Leclercq et al. (2017). Top panels show the observed Lyα, Si IIλ1260 and C IIλ1334 lines (grey line with observational uncertainties) with a selection of models from our grid of simulations. Blue curves correspond to best-fit models when applying the fitting procedure to Lyα only. The corresponding Si II and C II lines are given by the wind parameters constrained by the Lyα fit. Note that the metal column densities are unconstrained by this procedure, hence we let them take any possible values. Red curves correspond to models that are instead able to fit all lines at once (the thick red curve shows our best fit model). For C IIλ1334, we note that the resonant and fluorescent emissions are blended at MUSE resolution (both in the model and observed spectrum). In each panel, dashed and dotted vertical lines depict the resonant and fluorescent wavelengths respectively. Bottom panels present the posterior distributions of parameter values corresponding to our best fits using Lyα only (in blue) and all lines at once (in red).
Current usage metrics show cumulative count of Article Views (full-text article views including HTML views, PDF and ePub downloads, according to the available data) and Abstracts Views on Vision4Press platform.
Data correspond to usage on the plateform after 2015. The current usage metrics is available 48-96 hours after online publication and is updated daily on week days.
Initial download of the metrics may take a while.