Fig. 8.
Download original image
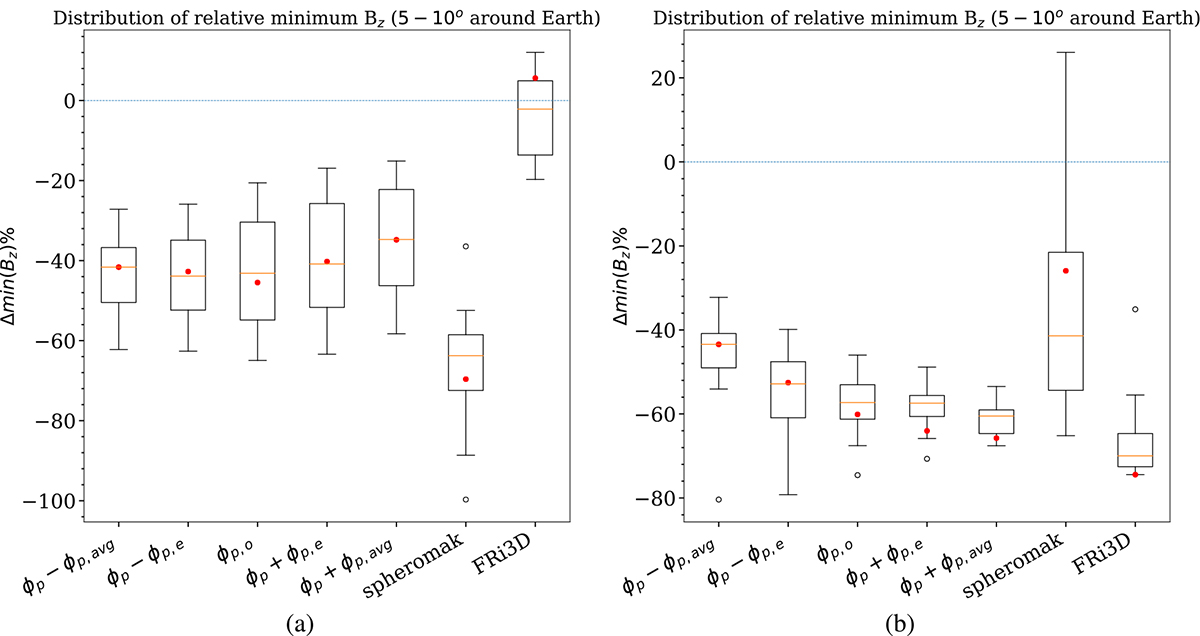
Boxplot of the spread of the relative minimum Bz (Δmin(Bz)) values at Earth and the virtual spacecraft at an offset of latitude and longitude of 5–10° – (a) Event 1, (b) Event 2. The red dot and the orange line in the boxes represent the Δmin(Bz) at the location of Earth and the median Δmin(Bz) of the distribution, respectively. The dashed blue line indicates Δmin(Bz) = 0 as a reference.
Current usage metrics show cumulative count of Article Views (full-text article views including HTML views, PDF and ePub downloads, according to the available data) and Abstracts Views on Vision4Press platform.
Data correspond to usage on the plateform after 2015. The current usage metrics is available 48-96 hours after online publication and is updated daily on week days.
Initial download of the metrics may take a while.