Fig. 6.
Download original image
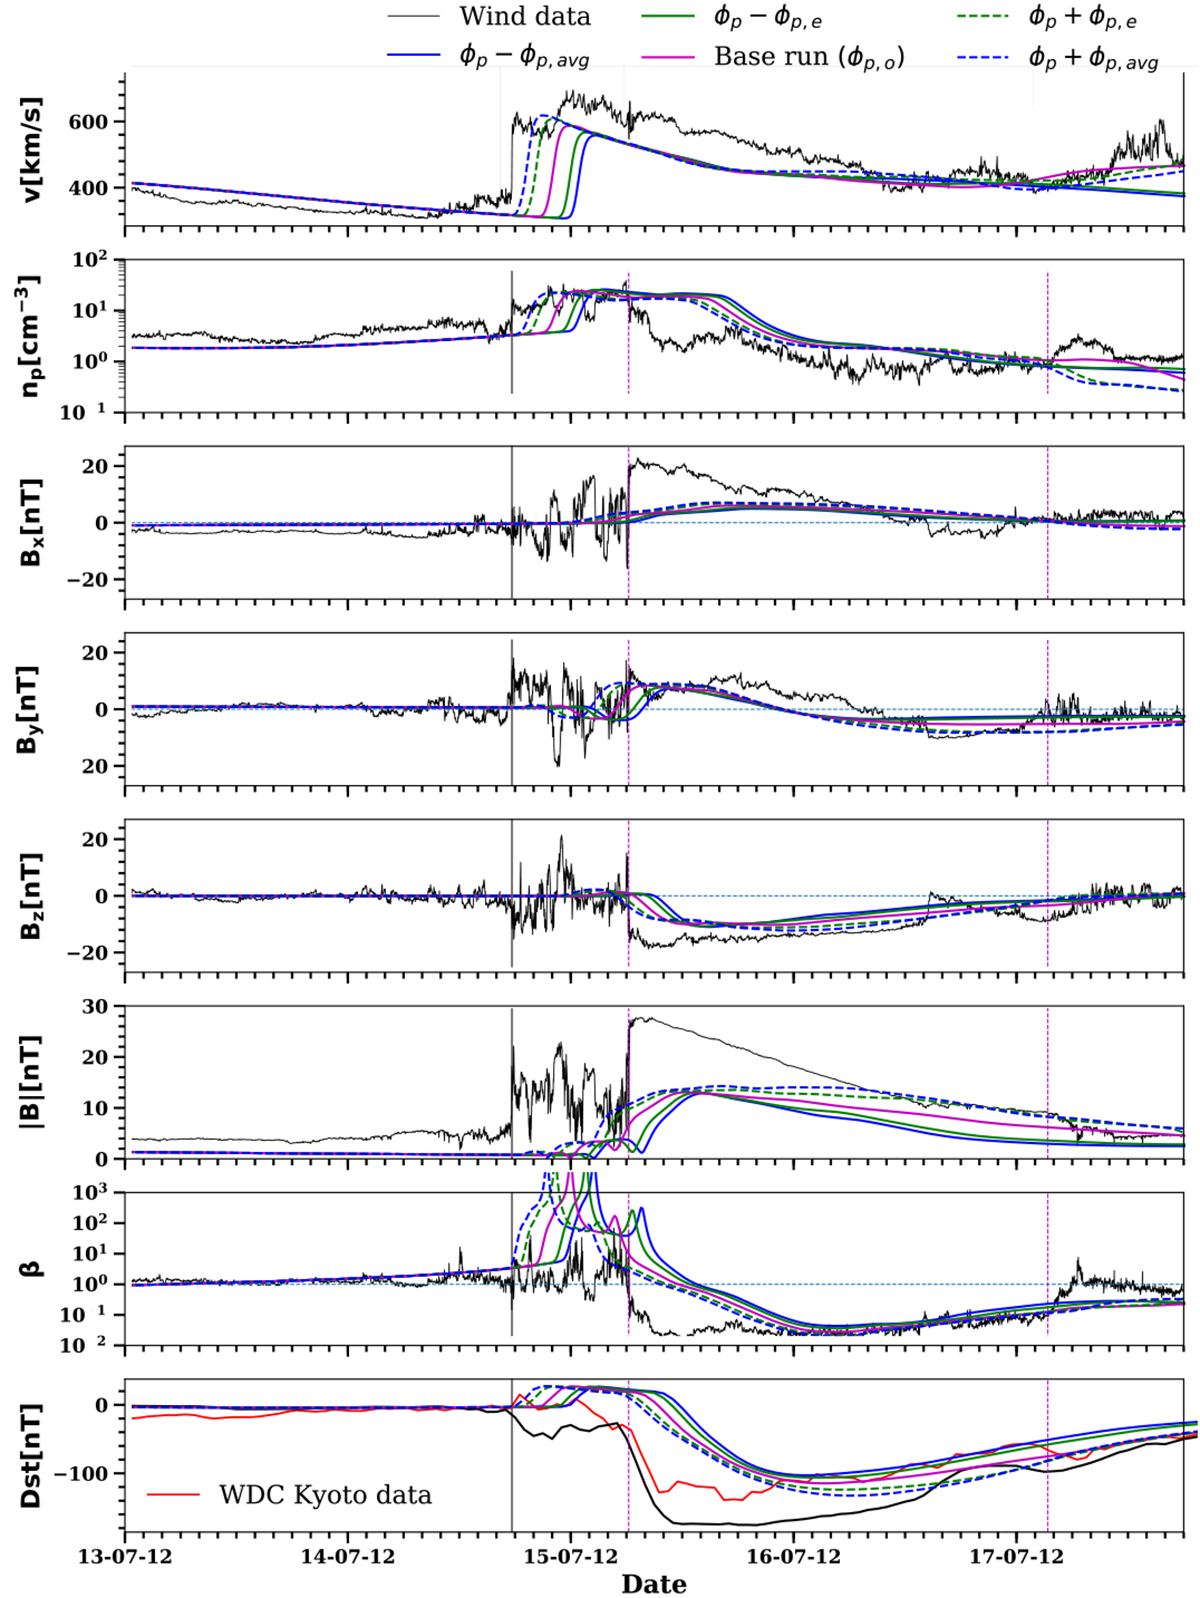
Results of Horseshoe ensemble simulations for Event 1 with varying ϕp obtained using EUHFORIA. Panels from top to bottom: speed (v), proton number density (np), Bx, By, Bz, magnetic field strength (|B|), plasma beta (β), and Dst. The observations from the WIND spacecraft are plotted in black in all the plasma and magnetic field properties panels. In the Dst panel, the observed Dst from WDC, Kyoto, is plotted in red, the reference modelled Dst using the observed data in black, and the Dst using EUHFORIA simulations in other colours. The solid black vertical line marks the shock arrival time, and the dashed magenta lines show the start and end of the magnetic cloud as reported in the WIND ICME catalogue (https://wind.nasa.gov/ICME_catalog/ICME_catalog_viewer.php).
Current usage metrics show cumulative count of Article Views (full-text article views including HTML views, PDF and ePub downloads, according to the available data) and Abstracts Views on Vision4Press platform.
Data correspond to usage on the plateform after 2015. The current usage metrics is available 48-96 hours after online publication and is updated daily on week days.
Initial download of the metrics may take a while.