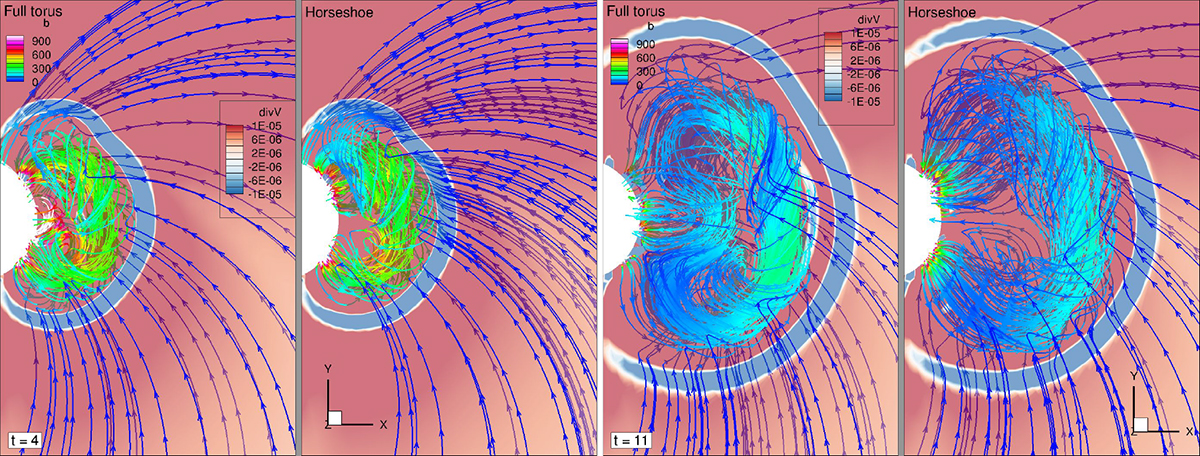
Fig. 2.
Download original image
Equatorial snapshot of EUHFORIA simulations of the full torus and the Horseshoe implementation of the mMT magnetic field configuration. The evolution of the internal magnetic field lines of the CMEs (colour-coded with the magnetic field strength), 4 hours (panels 1–2), and 11 hours (panels 3–4), respectively, after the start of the injection at 0.1 au, is illustrated. In the background, the divergence of the speed is plotted. The sheath ahead of the magnetic cloud is depicted by the negative divergence (accumulation of plasma) region, showing a clear envelope around the CME. In panels 1 and 3, the rear part of the full torus is seen injected, whereas panels 2 and 4 show the horseshoe-like geometry creating CME leg-like structures connected to the inner boundary.
Current usage metrics show cumulative count of Article Views (full-text article views including HTML views, PDF and ePub downloads, according to the available data) and Abstracts Views on Vision4Press platform.
Data correspond to usage on the plateform after 2015. The current usage metrics is available 48-96 hours after online publication and is updated daily on week days.
Initial download of the metrics may take a while.