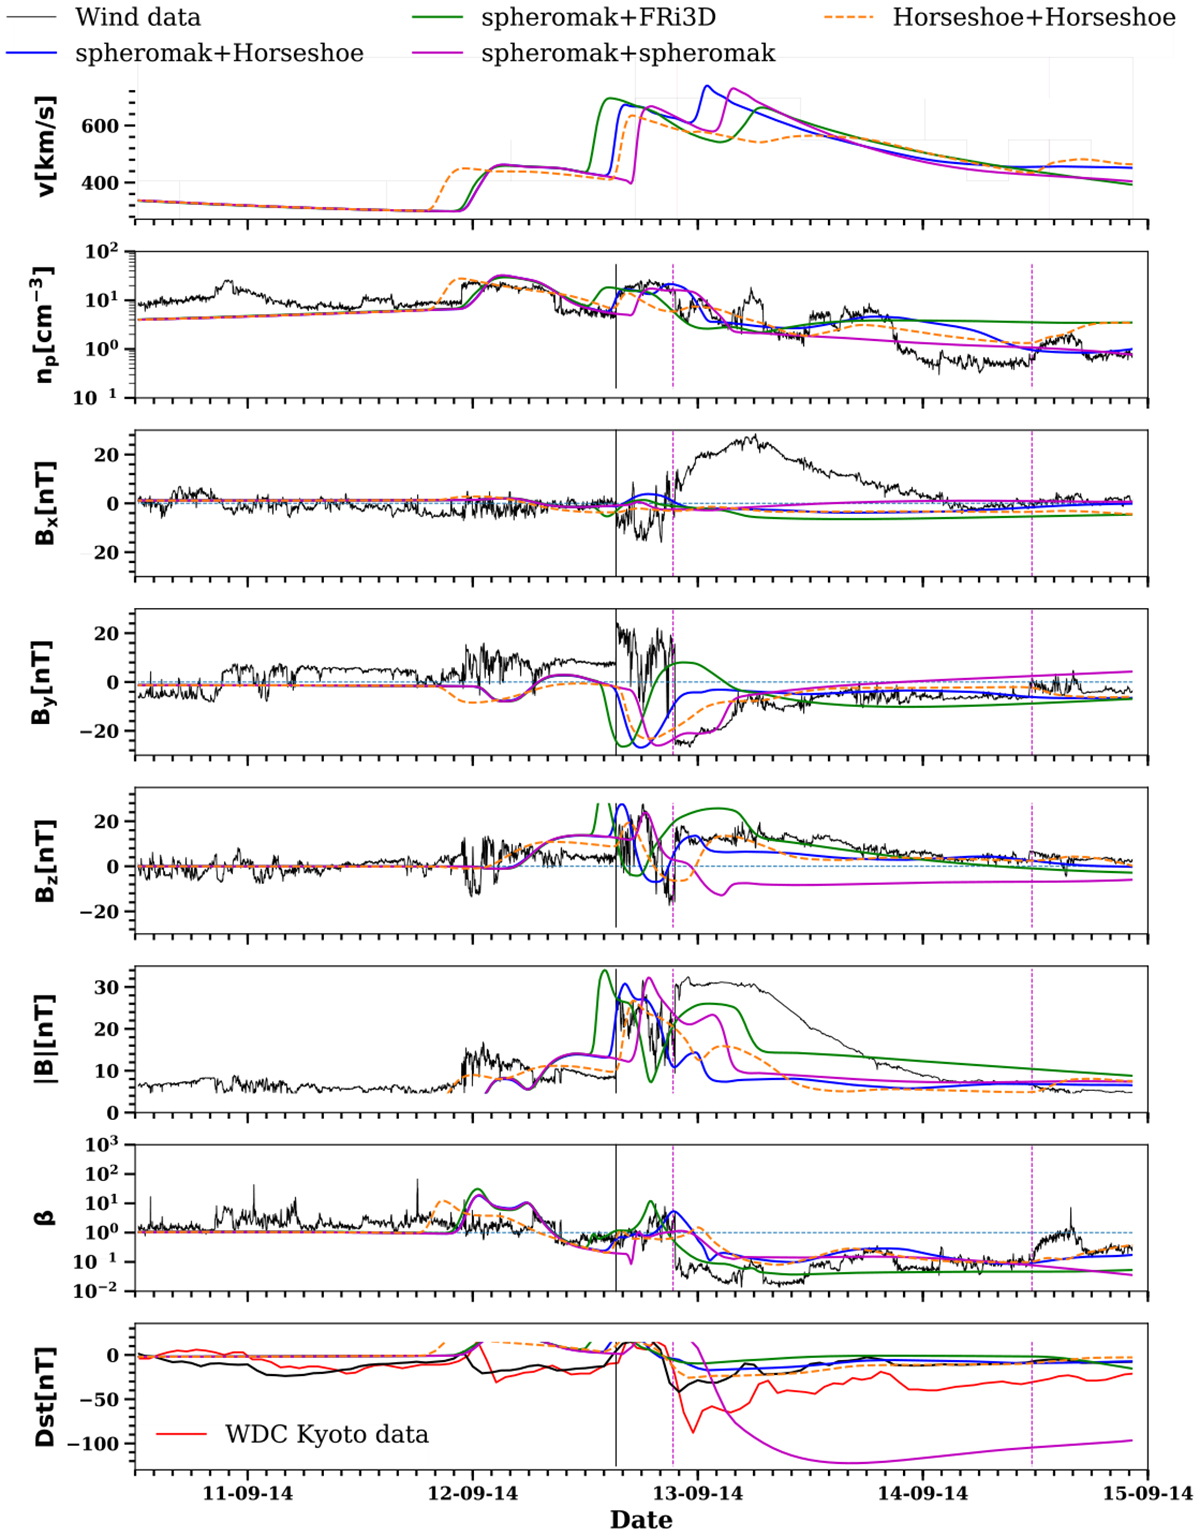
Fig. A.3.
Download original image
Comparison of the predicted CME profiles modelled with spheromak, FRi3D, and Horseshoe models for Event 2 (CME1 modelled with spheromak). An additional simulation with both CME1 and CME2 modelled with the Horseshoe model is provided (dashed orange line). The description of the plot panels is the same as for Fig. 6. The grey bar at the top of the Bz panel depicts the time span of the dynamic time warping analysis in Sect. 5.
Current usage metrics show cumulative count of Article Views (full-text article views including HTML views, PDF and ePub downloads, according to the available data) and Abstracts Views on Vision4Press platform.
Data correspond to usage on the plateform after 2015. The current usage metrics is available 48-96 hours after online publication and is updated daily on week days.
Initial download of the metrics may take a while.