Fig. 7.
Download original image
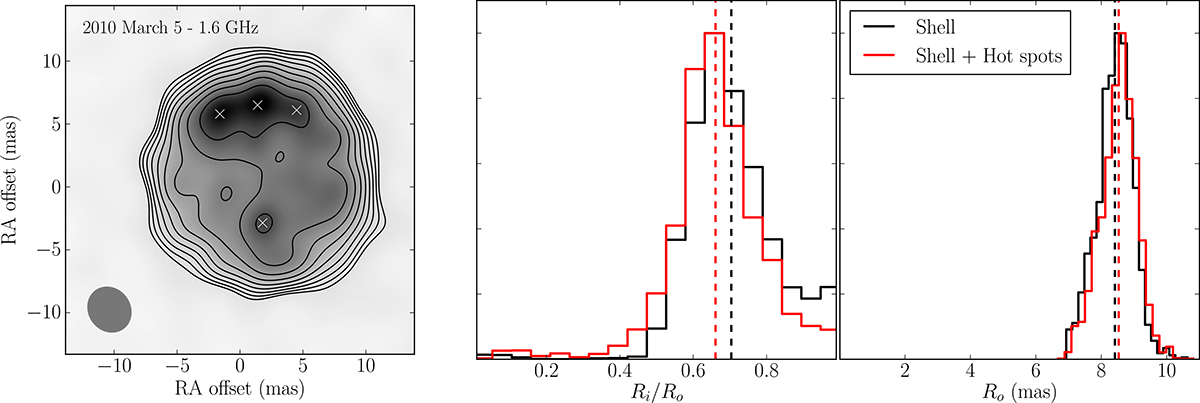
Image used to study the effect of shell inhomogeneities on the expansion curve. Left, CLEAN image of SN 1993J at L band on March 5, 2010. The 10 contours are set logarithmically, from the image peak (0.12 mJy/beam) to 10% of the peak. The FWHM of the convolving Gaussian beam is shown at the bottom left corner (3.72 × 3.28 mas, with a position angle of −36°). The best-fit shell model for this epoch is used to generate synthetic observations, from which the posterior shell parameter distributions are determined (black histograms; center and right panels). Then, the most prominent hot spots in the image (white crosses in the left panel) are added to the synthetic data, to determine new parameter distributions (red histograms). The dashed lines at the center and right panels mark the parameter averages for each case.
Current usage metrics show cumulative count of Article Views (full-text article views including HTML views, PDF and ePub downloads, according to the available data) and Abstracts Views on Vision4Press platform.
Data correspond to usage on the plateform after 2015. The current usage metrics is available 48-96 hours after online publication and is updated daily on week days.
Initial download of the metrics may take a while.