Fig. 2.
Download original image
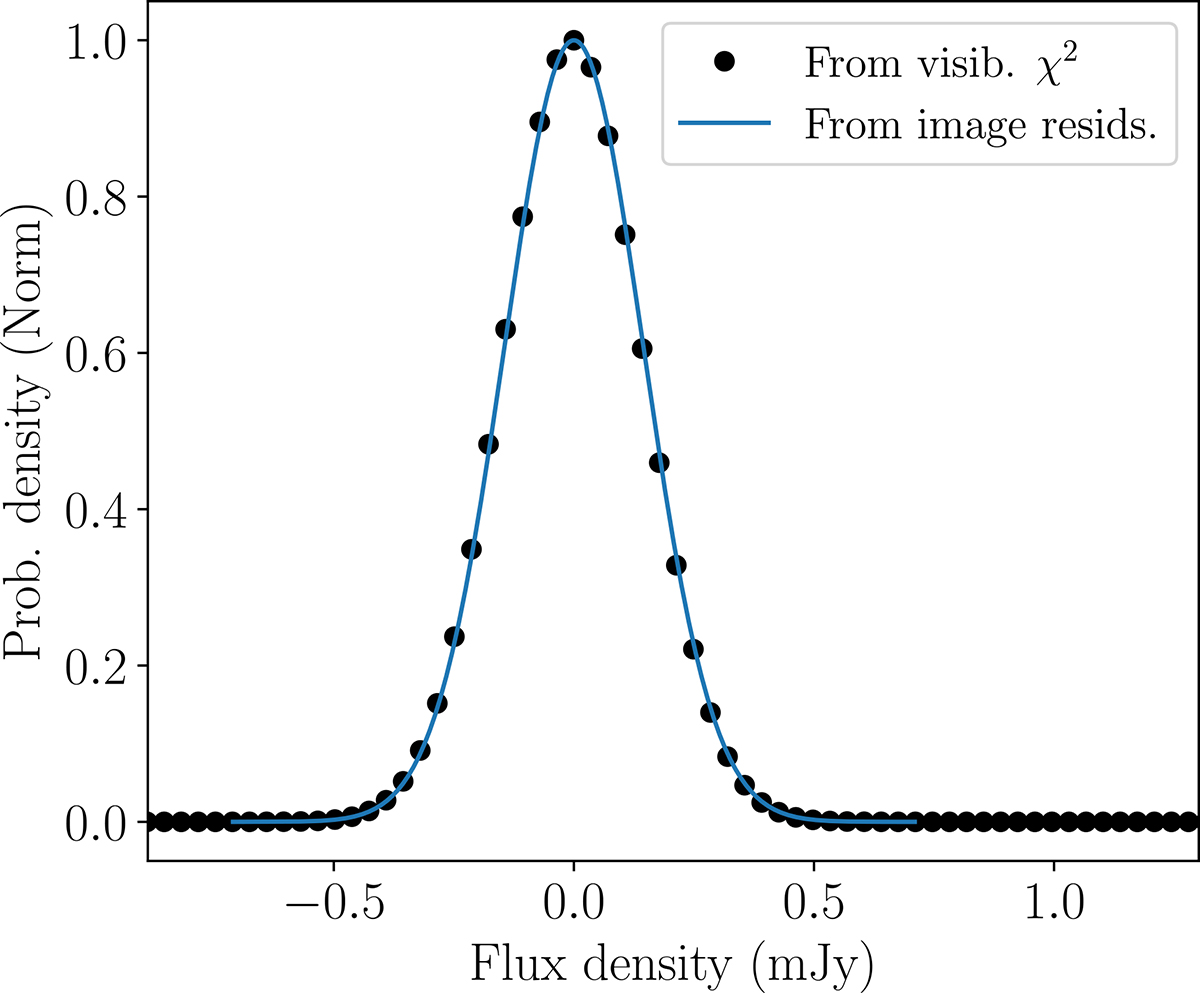
Probability density of the flux density of a point source fit to the visibility residuals of day 1639 (C band). Black points are estimates from the likelihood function (after scaling of the visibility uncertainties). The line is the expected distribution, assuming that the image rms (using natural weighting) is equal to the flux-density sensitivity of the observations.
Current usage metrics show cumulative count of Article Views (full-text article views including HTML views, PDF and ePub downloads, according to the available data) and Abstracts Views on Vision4Press platform.
Data correspond to usage on the plateform after 2015. The current usage metrics is available 48-96 hours after online publication and is updated daily on week days.
Initial download of the metrics may take a while.