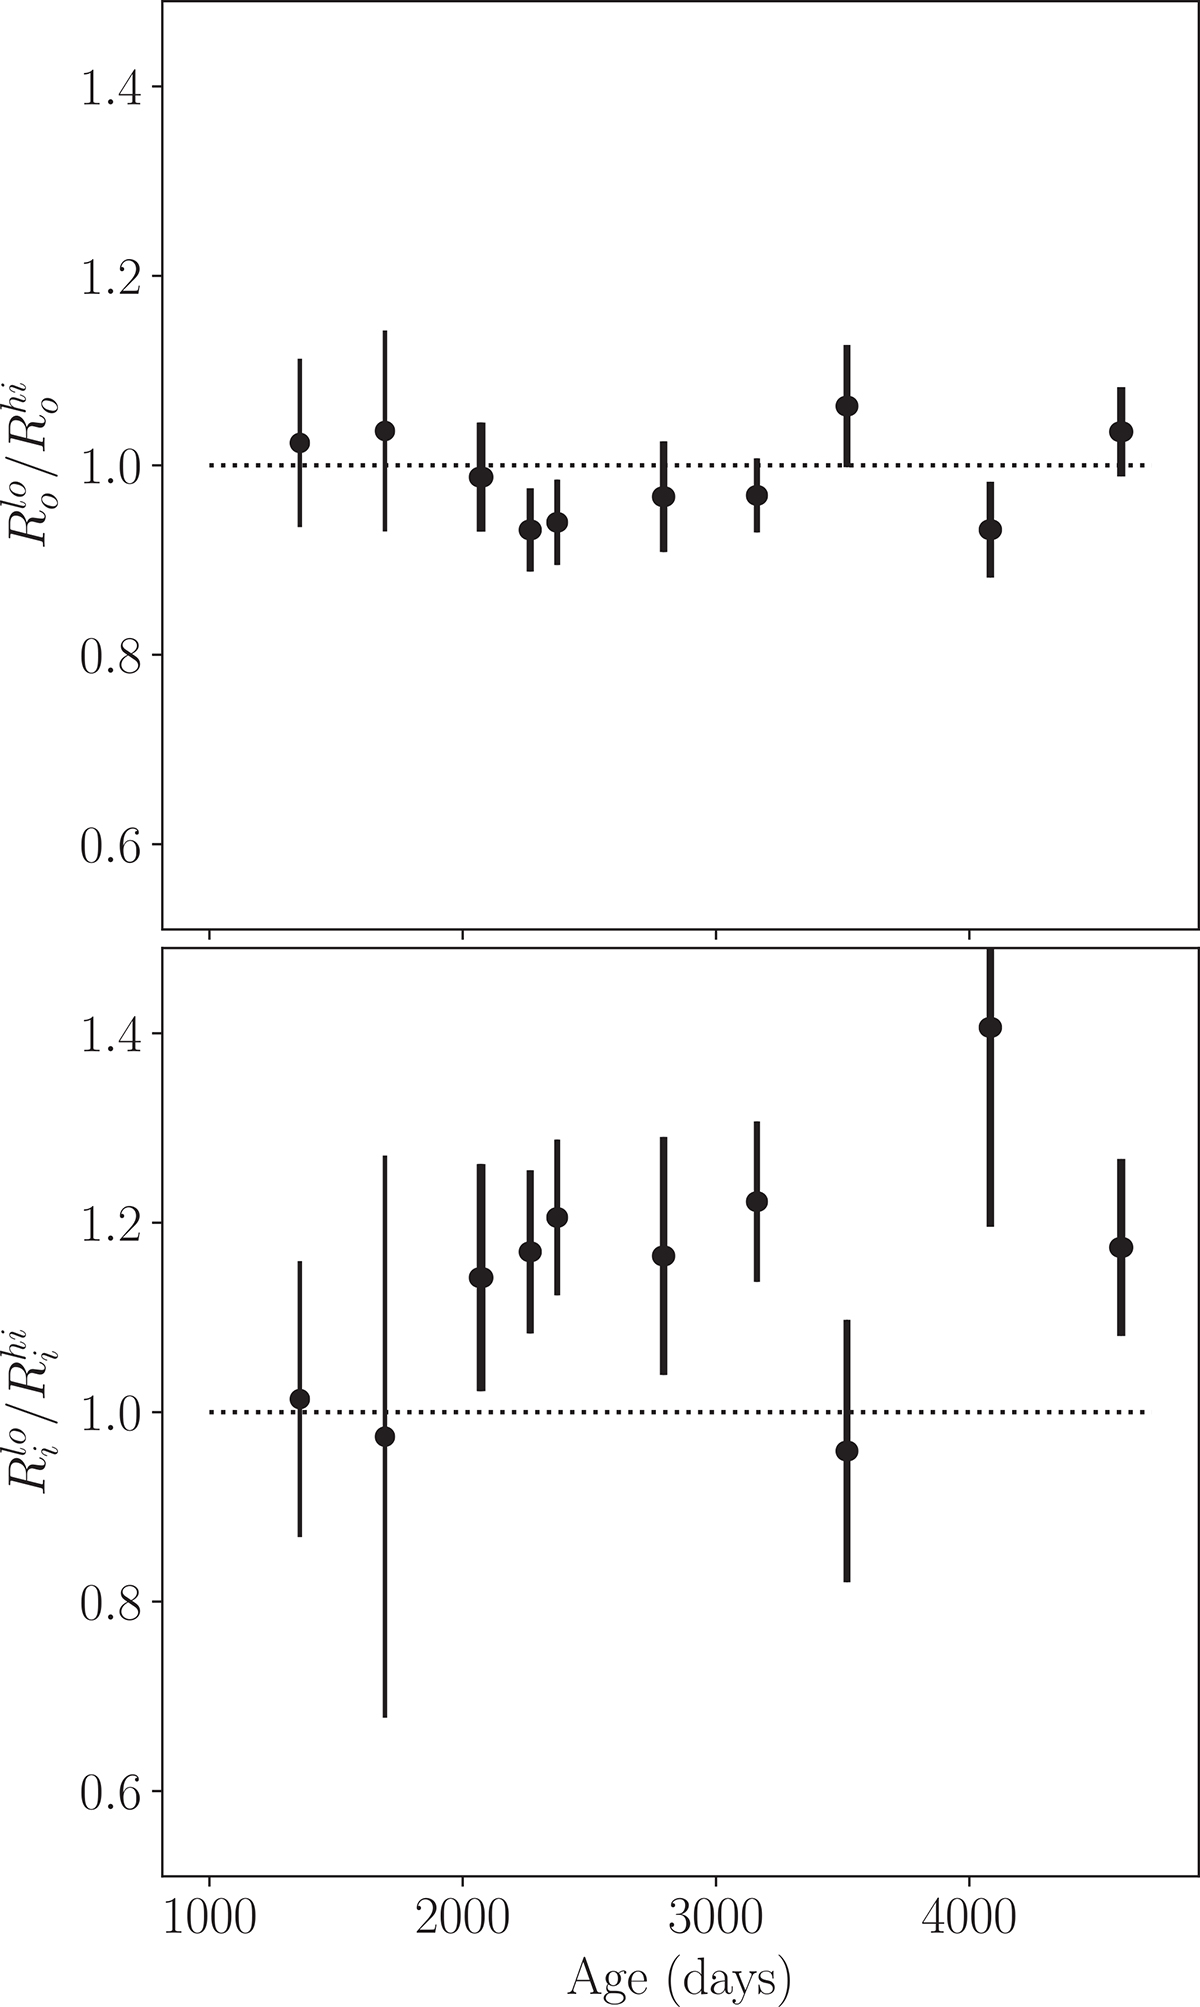
Fig. 11.
Download original image
Frequency effects in the expansion curve. Top: Ratio of outer shell sizes between data at low frequencies (L and S bands) and data at high frequencies (C and X bands) as a function of time. Bottom: Ratio of inner shell sizes between low and high frequencies. All pairs of epochs at different frequencies within 20 days of observation have been combined in this figure.
Current usage metrics show cumulative count of Article Views (full-text article views including HTML views, PDF and ePub downloads, according to the available data) and Abstracts Views on Vision4Press platform.
Data correspond to usage on the plateform after 2015. The current usage metrics is available 48-96 hours after online publication and is updated daily on week days.
Initial download of the metrics may take a while.