Fig. 6
Download original image
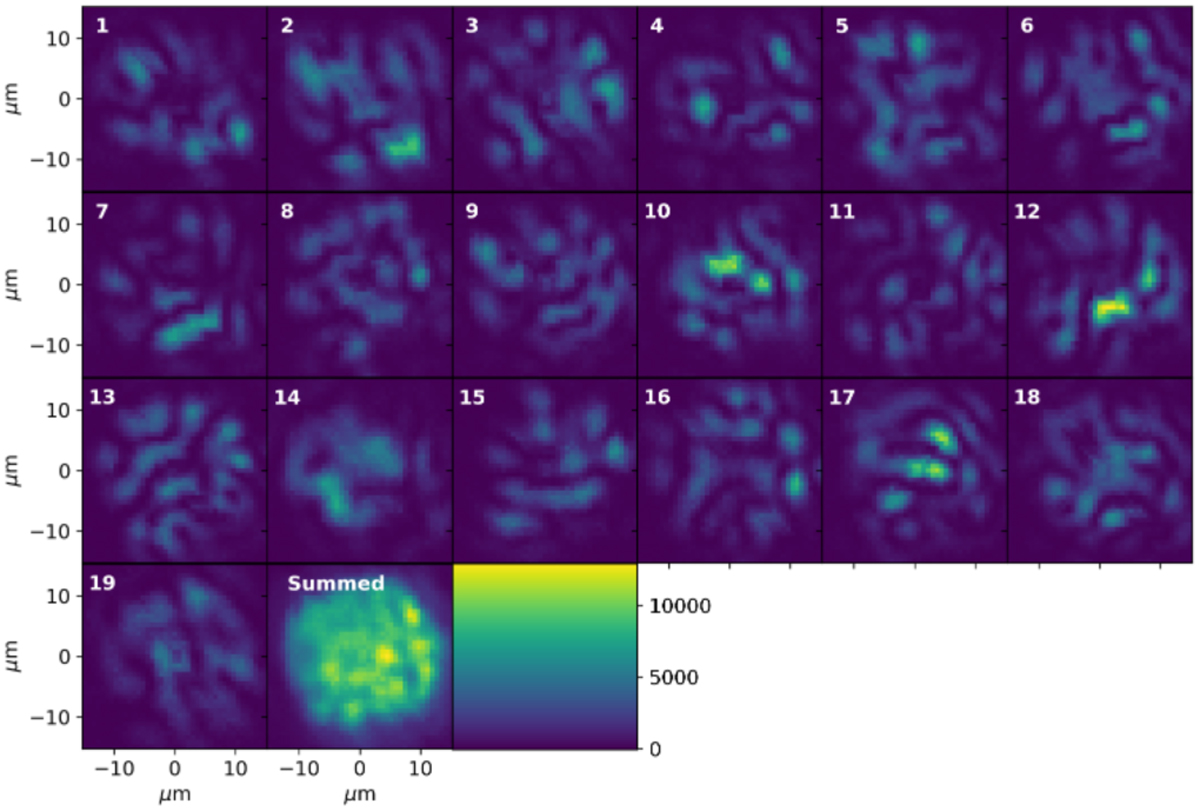
Coupling maps computed for all 19 outputs, acquired for a focal ratios of 4 and at a wavelength of 765.5 nm. The coupling map for each output presents some fine high-order structures, similarly to the light distribution when imaging retro-injected light into the SM outputs. The sum of the coupling maps for each wavelength provides a smoother pattern.
Current usage metrics show cumulative count of Article Views (full-text article views including HTML views, PDF and ePub downloads, according to the available data) and Abstracts Views on Vision4Press platform.
Data correspond to usage on the plateform after 2015. The current usage metrics is available 48-96 hours after online publication and is updated daily on week days.
Initial download of the metrics may take a while.