Open Access
Fig. 5
Download original image
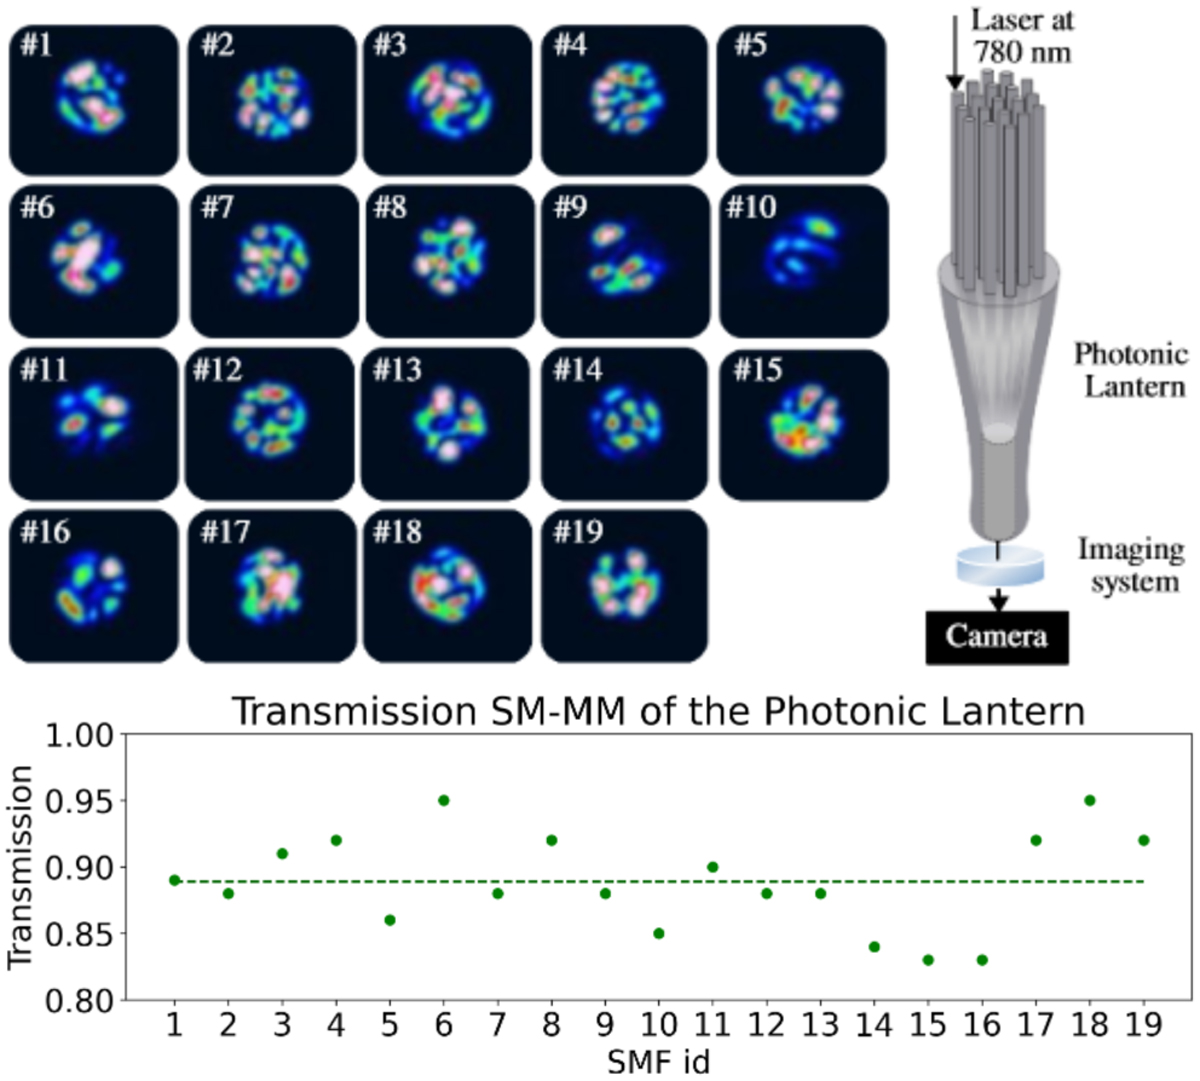
PL lab characterization. Top panel: distribution of the intensity of the light at the PL input after retro-injecting a 780 nm laser in each of the PL SM outputs. Lower panel: transmission from the SM end to the MM end of the PL, for each of the 19 SMFs.
Current usage metrics show cumulative count of Article Views (full-text article views including HTML views, PDF and ePub downloads, according to the available data) and Abstracts Views on Vision4Press platform.
Data correspond to usage on the plateform after 2015. The current usage metrics is available 48-96 hours after online publication and is updated daily on week days.
Initial download of the metrics may take a while.