Fig. 19
Download original image
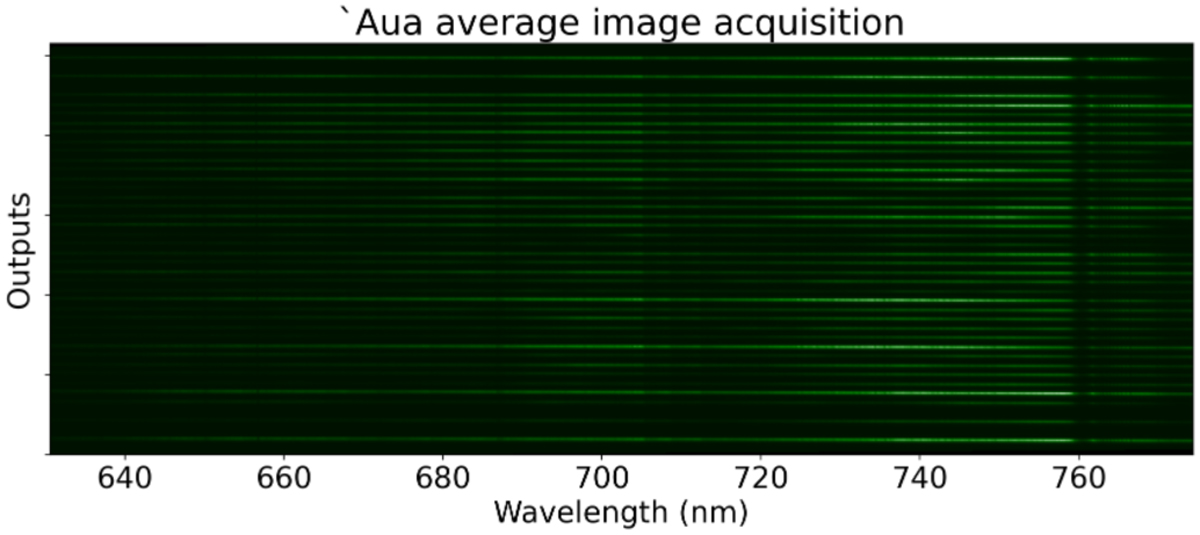
Spectra of ‘Aua acquired with the PL. The horizontal axis is the wavelength dispersion, and vertically we have the 38 output traces corresponding to the two polarizations from each of the PL 19 SMF outputs. This image was computed from 53 minutes of observation at a framerate of 200 Hz, after selection of the best 90% of frames.
Current usage metrics show cumulative count of Article Views (full-text article views including HTML views, PDF and ePub downloads, according to the available data) and Abstracts Views on Vision4Press platform.
Data correspond to usage on the plateform after 2015. The current usage metrics is available 48-96 hours after online publication and is updated daily on week days.
Initial download of the metrics may take a while.