Fig. 13
Download original image
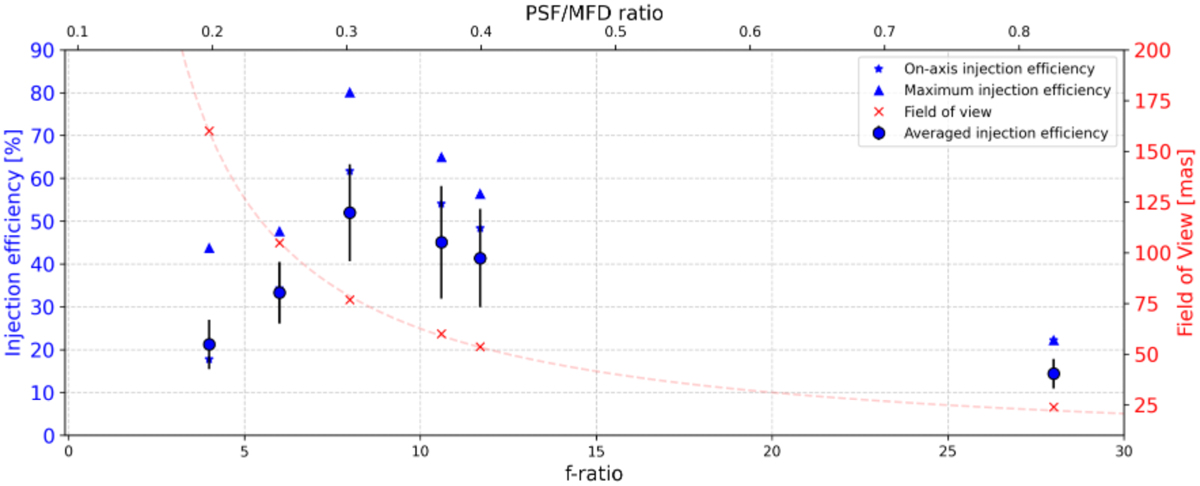
Variation of the injection efficiency measured at 642 nm as a function of the focal ratio (bottom horizontal axis), or as a function of the ratio between the PSF size and MFD of the PL (top horizonal axis). For each focal ratio experimentally tested, we represent the on-axis injection efficiency, the maximum efficiency, and the average over the whole scanned area (see the coupling maps). The FoV projected on-sky is also plotted with red crosses (right axis).
Current usage metrics show cumulative count of Article Views (full-text article views including HTML views, PDF and ePub downloads, according to the available data) and Abstracts Views on Vision4Press platform.
Data correspond to usage on the plateform after 2015. The current usage metrics is available 48-96 hours after online publication and is updated daily on week days.
Initial download of the metrics may take a while.