Open Access
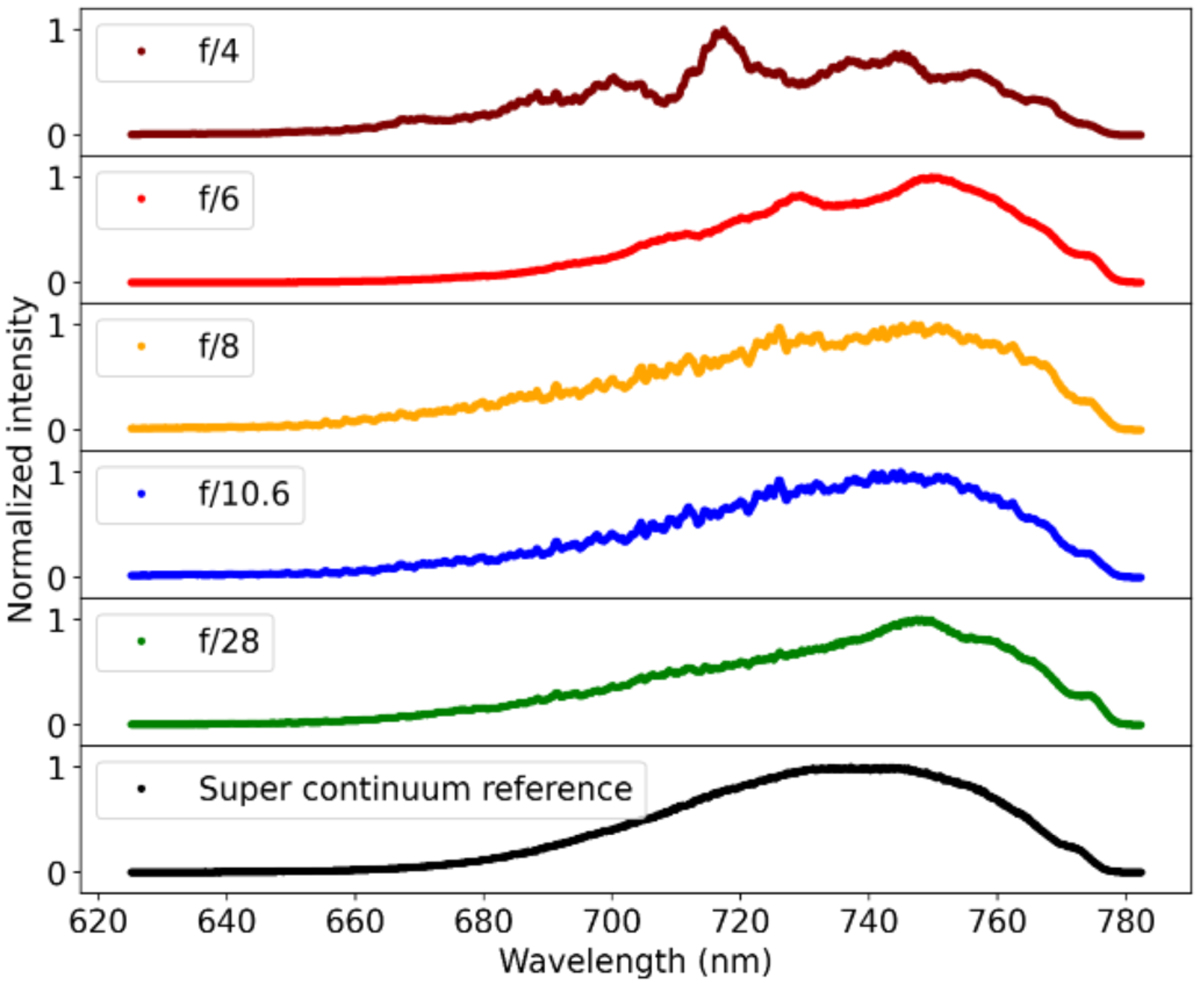
Fig. 12
Download original image
Super continuum spectrum reconstructions from PL data at various focal ratios. Each spectrum is normalized by its maximal value. The spectra can be compared to the reference on the bottom plot, obtained with an SMF.
Current usage metrics show cumulative count of Article Views (full-text article views including HTML views, PDF and ePub downloads, according to the available data) and Abstracts Views on Vision4Press platform.
Data correspond to usage on the plateform after 2015. The current usage metrics is available 48-96 hours after online publication and is updated daily on week days.
Initial download of the metrics may take a while.