Fig. 22
Download original image
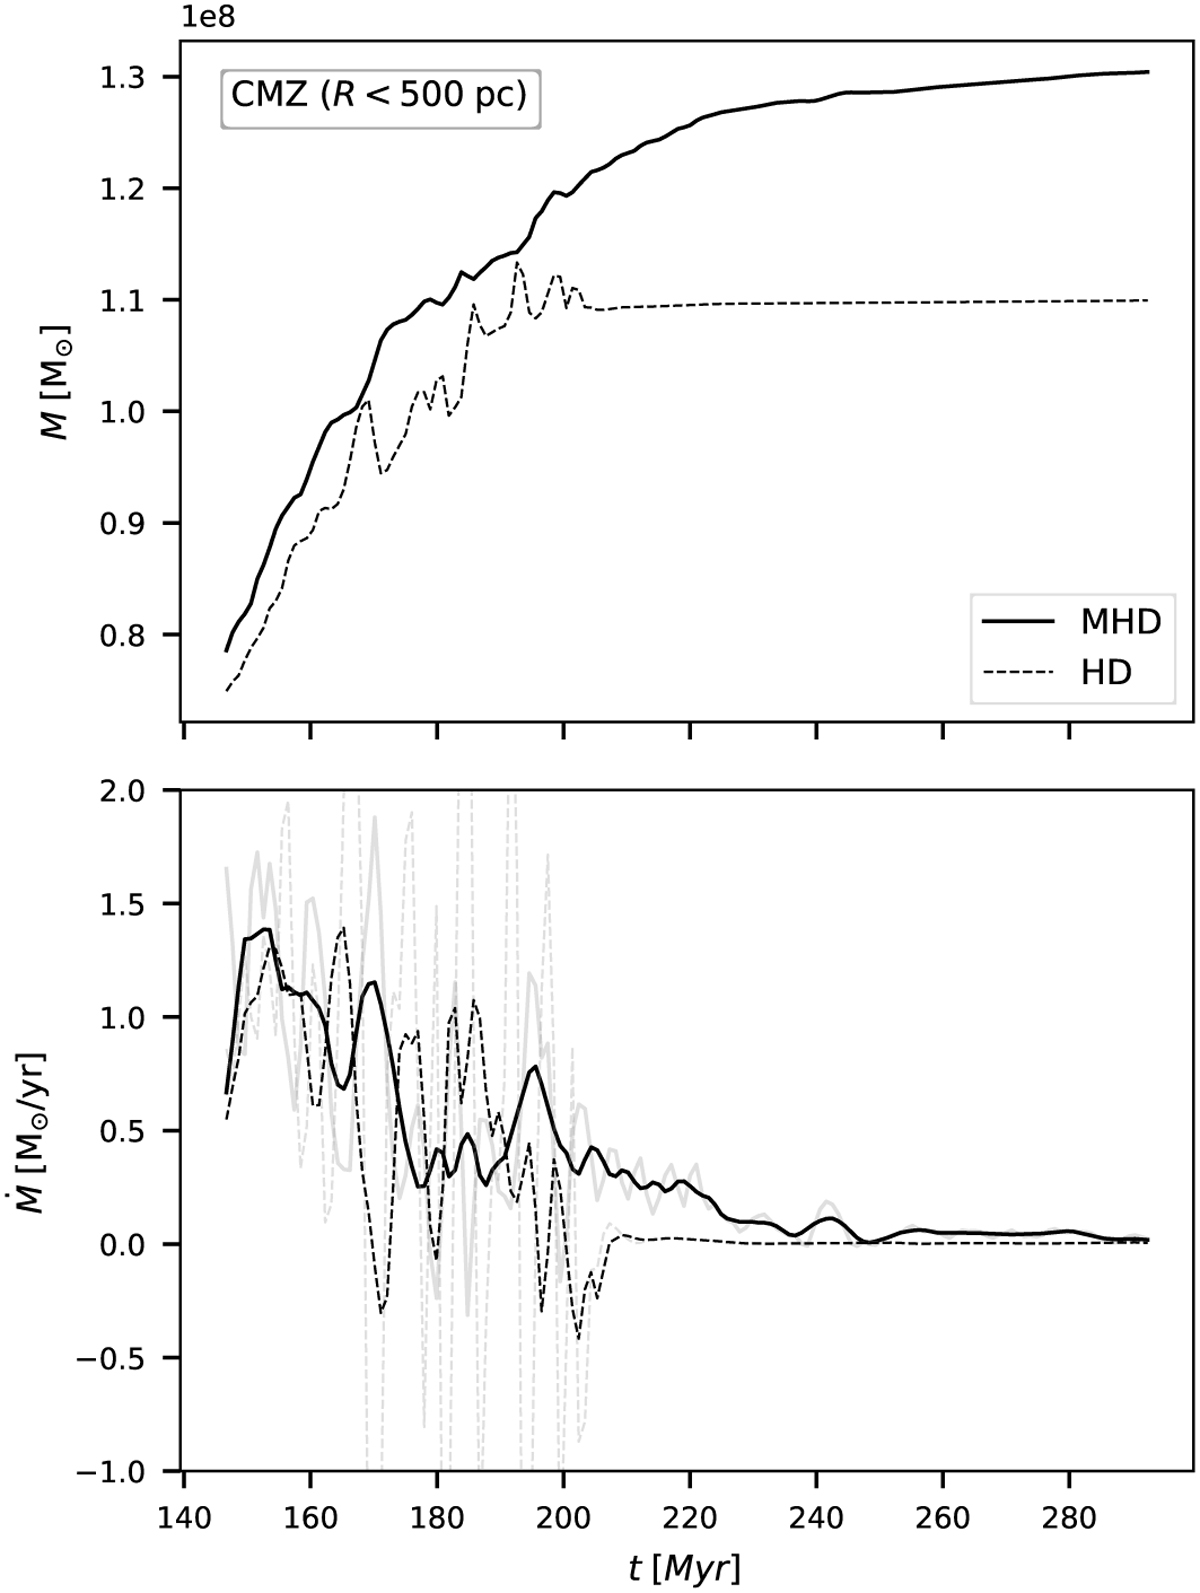
Mass accretion from the disc to the CMZ. Top: mass contained in the cylindrical volume R < 500 pc as a function of time for the CHEM_MHD and CHEM_HD simulations. Bottom: inflow rate into the same volume, which represents the inflow onto the CMZ ring. The black lines represent the running average (over 7 Myr) of the inflow rate, to smooth out the high time variability of Ṁ. The instantaneous (non-averaged) inflow rate is shown as the light grey lines. The inflow rate in the MHD and HD simulation has a similar order of magnitude, but it lasts longer in the MHD simulation (roughly until t ≃ 200 Myr in the HD simulation versus t 240 Myr in the MHD simulation). This is because magnetic fields transport gas radially inwards within the disc at R > 3 kpc and replenish the gas reservoir that supplies the bar-driven inflow at the outskirts of the bar, which instead runs out of gas in the purely HD simulations. Inflow at these scales is mainly driven by the gravitational torques of the Galactic bar (Sect. 7).
Current usage metrics show cumulative count of Article Views (full-text article views including HTML views, PDF and ePub downloads, according to the available data) and Abstracts Views on Vision4Press platform.
Data correspond to usage on the plateform after 2015. The current usage metrics is available 48-96 hours after online publication and is updated daily on week days.
Initial download of the metrics may take a while.