Fig. 21
Download original image
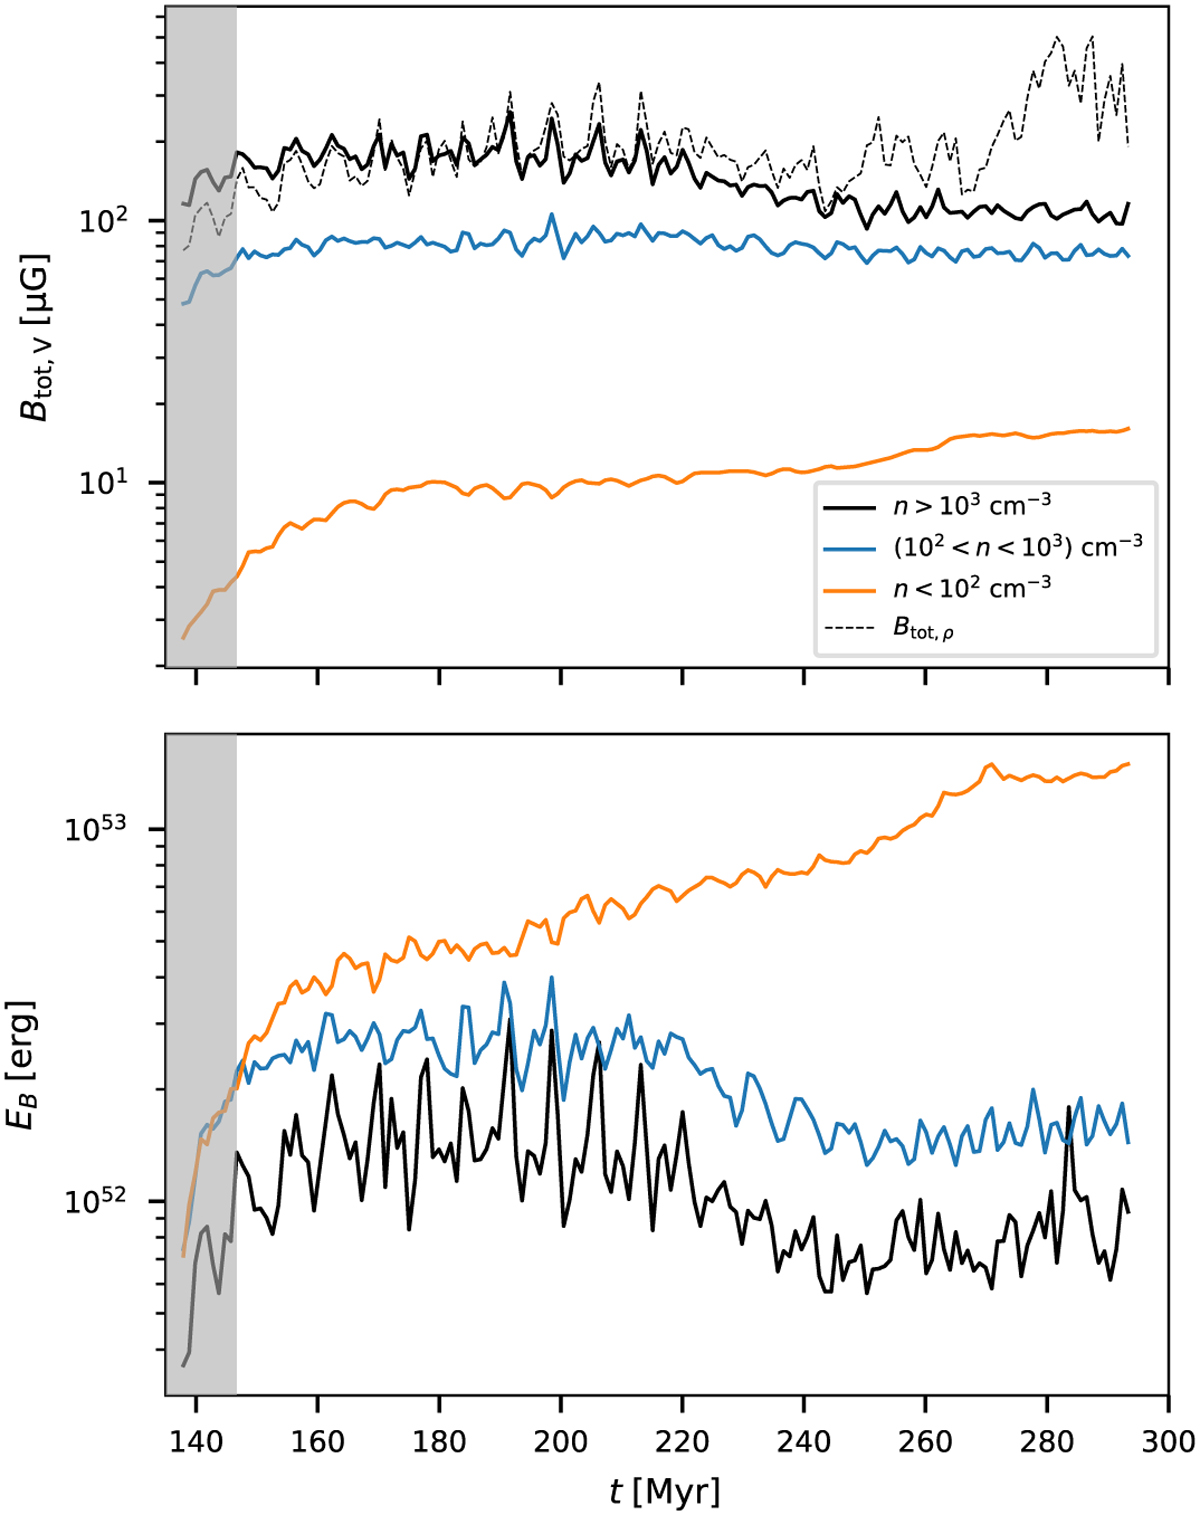
Time evolution of the magnetic field in our fiducial CHEM_MHD simulation at R < 500 pc and |z| < 100 pc. Top: the full lines are the volume-weighted magnetic fields (Eq. (13)) averaged over the indicated density range. The black dashed line is the mass-weighted magnetic field averaged over all densities (Eq. (13)). The figure shows that the field grows in time starting from the initial seed as a result of dynamo action (Sect. 6). Bottom: integrated magnetic energy in the same density regimes. We note that while the denser part of the ISM has higher magnetic field values, most of the magnetic energy is actually in the low density regime.
Current usage metrics show cumulative count of Article Views (full-text article views including HTML views, PDF and ePub downloads, according to the available data) and Abstracts Views on Vision4Press platform.
Data correspond to usage on the plateform after 2015. The current usage metrics is available 48-96 hours after online publication and is updated daily on week days.
Initial download of the metrics may take a while.