Fig. 2
Download original image
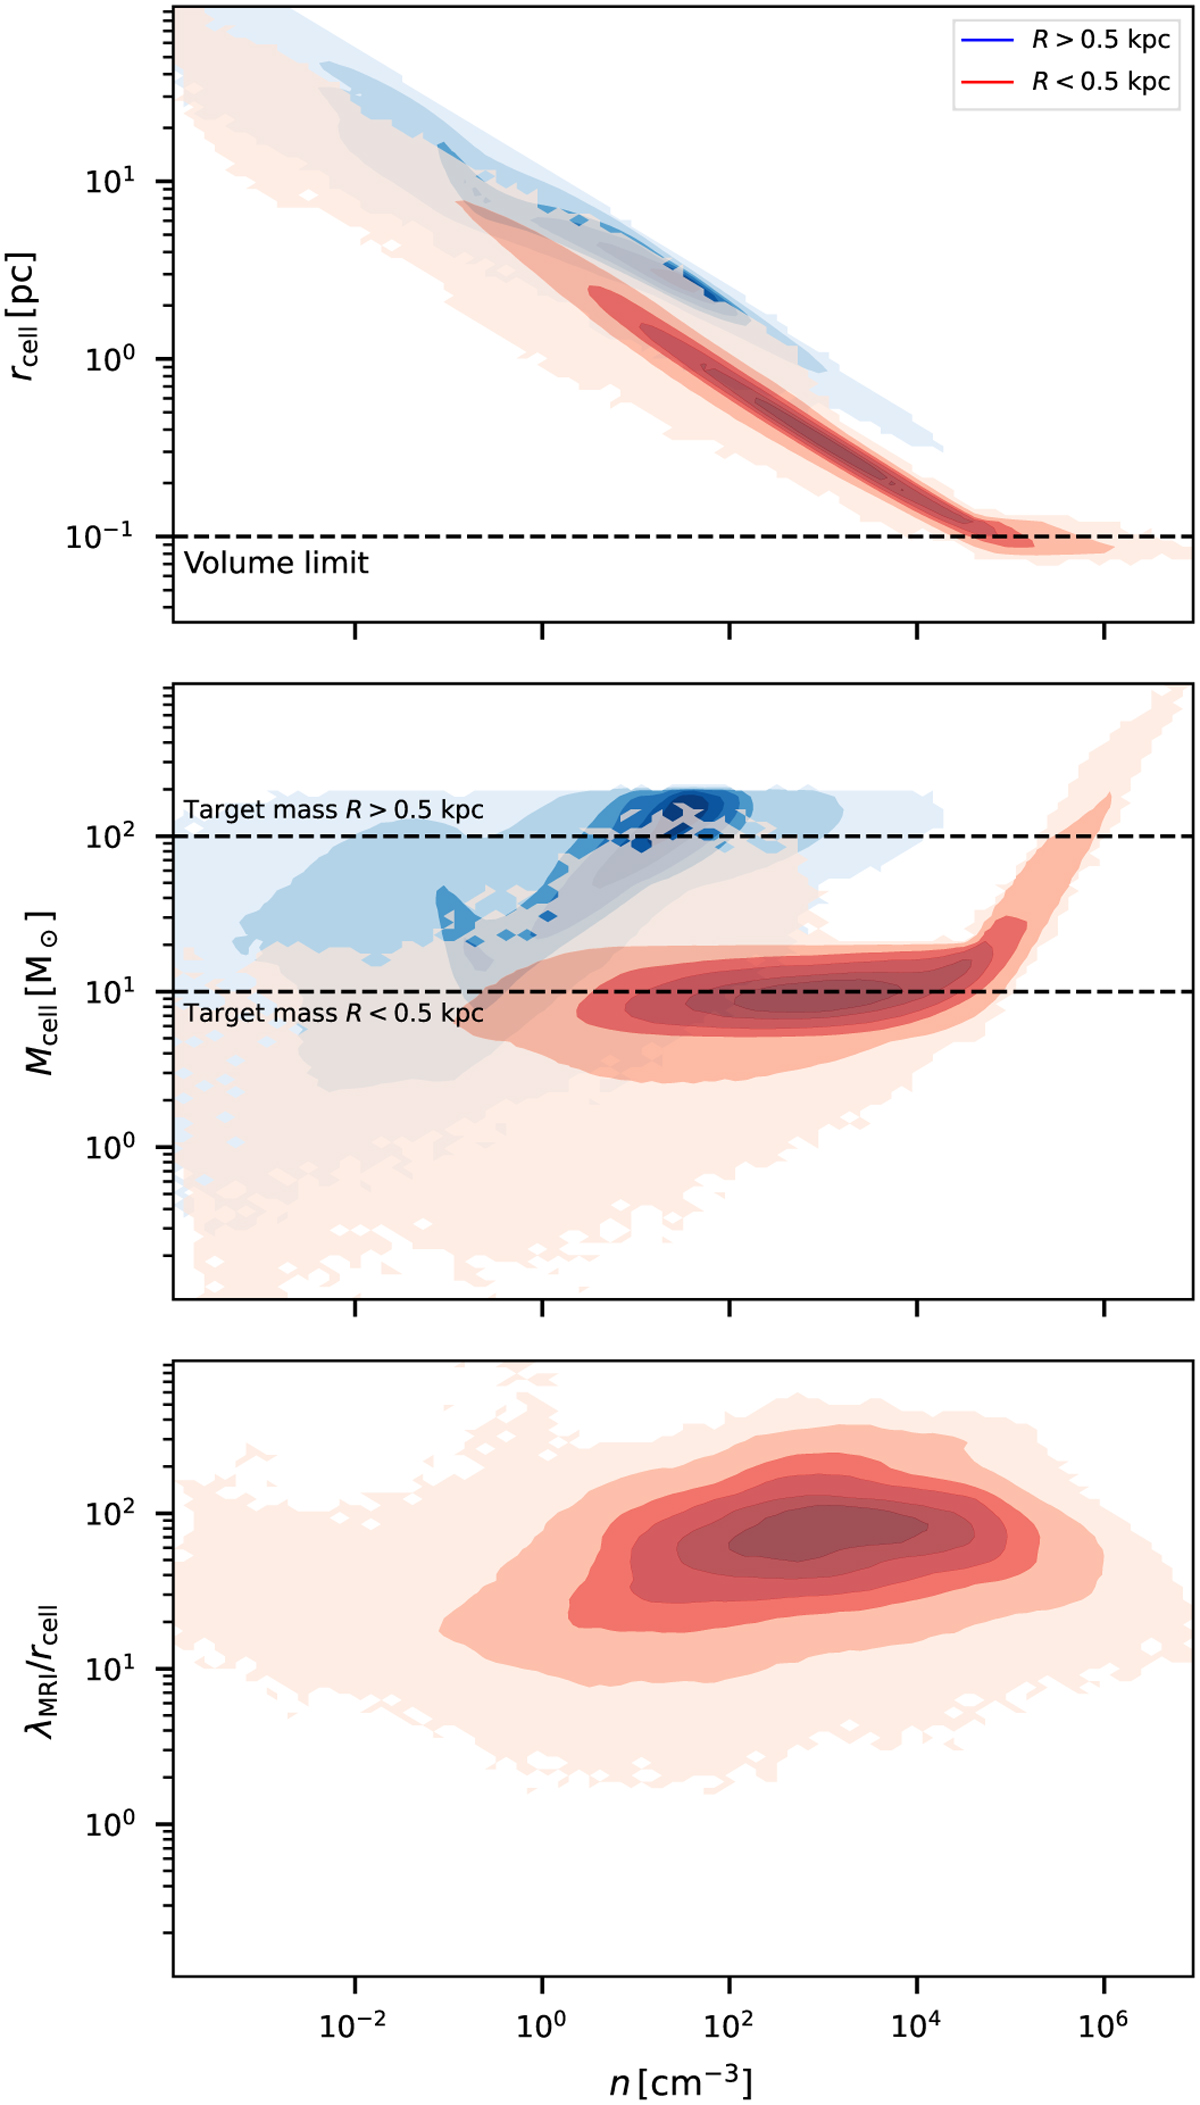
Resolution in our fiducial CHEM_MHD simulation (Table 1) at t = 196 Myr. Top: spatial resolution as a function of total gas density. rcell is the radius of a sphere with the same volume as the cell. The horizontal black dashed line indicates the volume limit of the cells (Sect. 2.2). Middle: mass of cells as a function of density. In both panels, blue contours are for the region at R > 0.5 kpc with a target mass of 100 M⊙, while red contours are for the R < 0.5 kpc with higher resolution at a target mass of 10 M⊙ (Sect. 2.2). Bottom: λMRI/rcell as a function of density for cells in the CMZ (R < 0.5 kpc), where λMRI = 2πυA/Ω. is the characteristic wavelength of the MRI, υA is the Alfven speed, and Ω = υϕ/R is the angular velocity of each gas cell. We see that the MRI is well resolved in the CMZ. The contours contain [100, 99, 90, 75, 50, 25] % of the total number of cells.
Current usage metrics show cumulative count of Article Views (full-text article views including HTML views, PDF and ePub downloads, according to the available data) and Abstracts Views on Vision4Press platform.
Data correspond to usage on the plateform after 2015. The current usage metrics is available 48-96 hours after online publication and is updated daily on week days.
Initial download of the metrics may take a while.