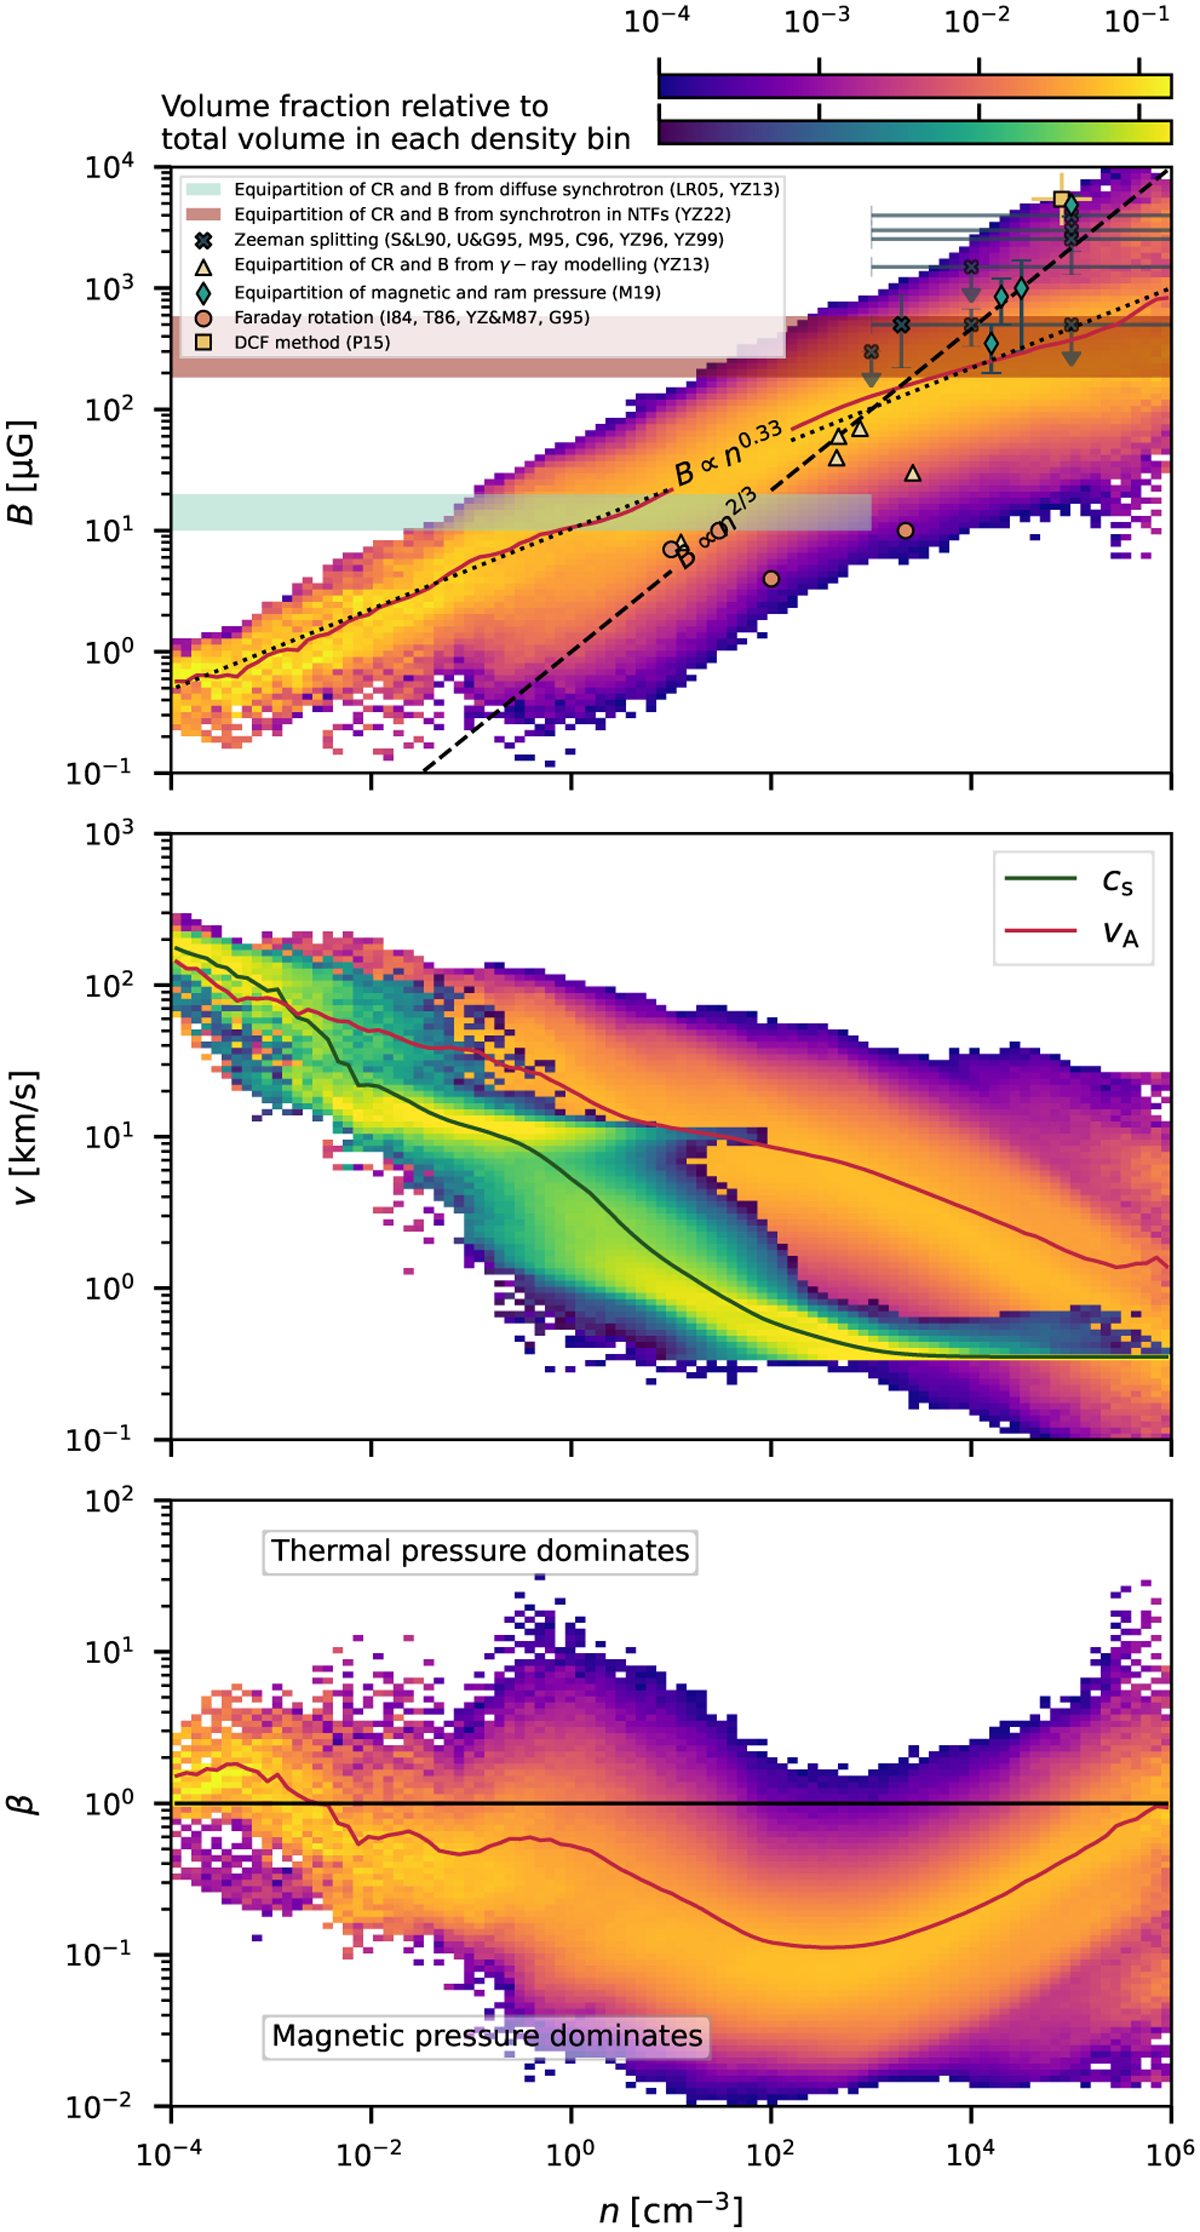
Fig. 17

Download original image
Magnetic field properties as a function of density at R < 500 pc in our fiducial CHEM_MHD simulation at t = 186 Myr. Top: magnetic field strength. The В ∝ п2/3 indicates the scaling expected from simple isotropic collapse with flux-freezing (Mestel 1965). The dotted line В ∝ n0.33 is the fit to the average instead. Symbols denote various estimates of the magnetic field in the CMZ from the literature. References are abbreviated as follows: LaRosa et al. (2005, LRO5), Yusef-Zadeh et al. (2013, YZ13), Yusef-Zadeh et al. (2022, YZ22), Schwarz & Lasenby (1990, S&L90), Uchida & Guesten (1995, U&G95), Marshall et al. (1995, M95), Crutcher et al. (1996, C96), Yusef-Zadeh et al. (1996, YZ96), Yusef-Zadeh et al. (1999, YZ99), Mangilli et al. (2019, M19), Inoue et al. (1984,184), Tsuboi et al. (1986, T86), Yusef-Zadeh & Morris (1987, YZ&M87), Gray et al. (1995, G95), Pillai et al. (2015, P15). Middle: Alſvén velocity (Eq. (10)) and thermal sound speed cs = γP/ρ where P is the thermal pressure (Eq. (7)). Bottom: plasma β = P/Pmag, where Pmag = B2/(8π) is the magnetic pressure. In all panels, each density slice is normalised separately for clarity of visualisation, and the solid lines show the average value at the given density.
Current usage metrics show cumulative count of Article Views (full-text article views including HTML views, PDF and ePub downloads, according to the available data) and Abstracts Views on Vision4Press platform.
Data correspond to usage on the plateform after 2015. The current usage metrics is available 48-96 hours after online publication and is updated daily on week days.
Initial download of the metrics may take a while.


