Fig. 14
Download original image
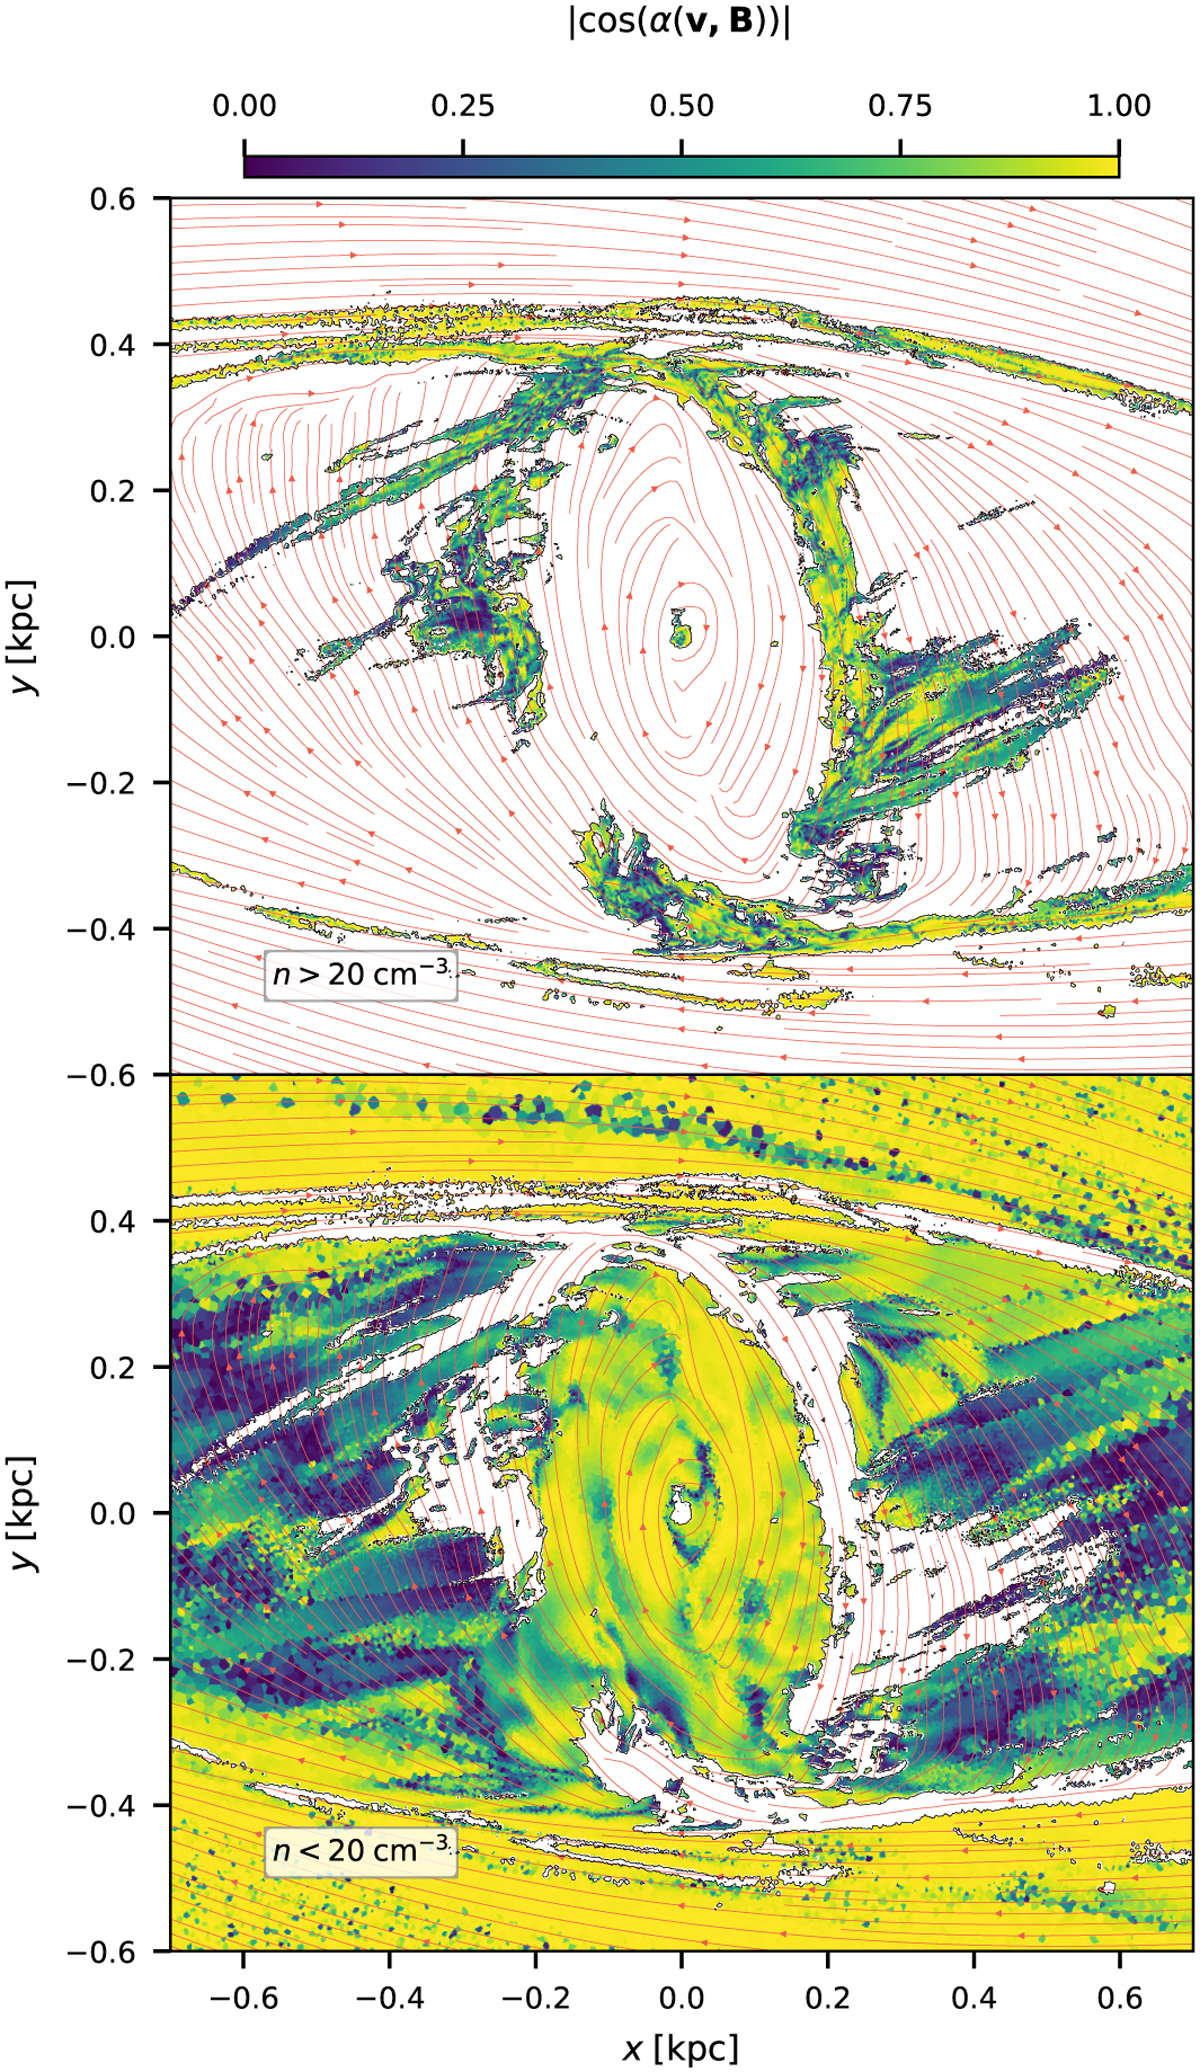
Relative orientation of the gas velocity and magnetic fields in a slice at ɀ = 0 in our fiducial CHEM_MHD simulation at t = 186 Myr. A snapshot at early time is chosen here to show the orientation in the dust lanes as well, which are depleted at later times. The colour-scale indicates cos α defined in Eq. (19), where cos α = 1 and cos α = 0 correspond to В and v being parallel and perpendicular respectively. Streamlines with red arrows trace gas velocity in the frame co-rotating with the bar. The plot is separated into two panels for densities n > 20 cm−3 (top) and n < 20 cm−3 (bottom) for clarity. Velocity and magnetic fields are well aligned in the less turbulent regions (cos a close to 1), while their orientation becomes progressively more random in regions where the turbulence is dynamically more important.
Current usage metrics show cumulative count of Article Views (full-text article views including HTML views, PDF and ePub downloads, according to the available data) and Abstracts Views on Vision4Press platform.
Data correspond to usage on the plateform after 2015. The current usage metrics is available 48-96 hours after online publication and is updated daily on week days.
Initial download of the metrics may take a while.