Fig. 13

Download original image
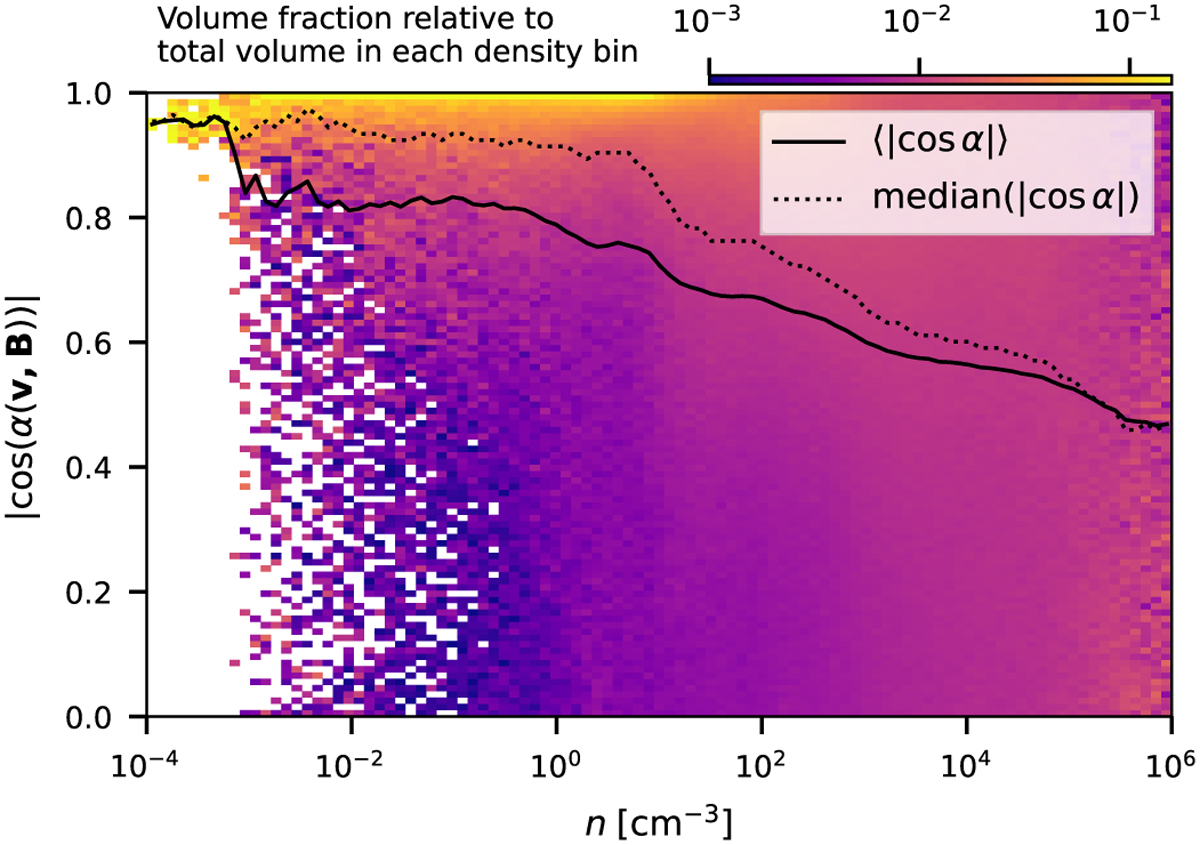
Relative orientation of the gas velocity and magnetic fields as a function of total gas density for our fiducial CHEM_MHD simulation at t = 186 Myr. Colours indicate the angle |cos α| defined by Eq. (19). Each slice at fixed n is normalised separately for improved clarity. The black solid line shows the average value of cos α at the given density while the dotted one shows the median instead. If the orientation of v with respect to В were completely random (in the solid angle), the distribution would be uniform and the black lines would be horizontal at a value |cos α| = 0.5. The plot shows that the velocity and magnetic fields become progressively more random as we move to higher densities.
Current usage metrics show cumulative count of Article Views (full-text article views including HTML views, PDF and ePub downloads, according to the available data) and Abstracts Views on Vision4Press platform.
Data correspond to usage on the plateform after 2015. The current usage metrics is available 48-96 hours after online publication and is updated daily on week days.
Initial download of the metrics may take a while.


