Fig. 10
Download original image
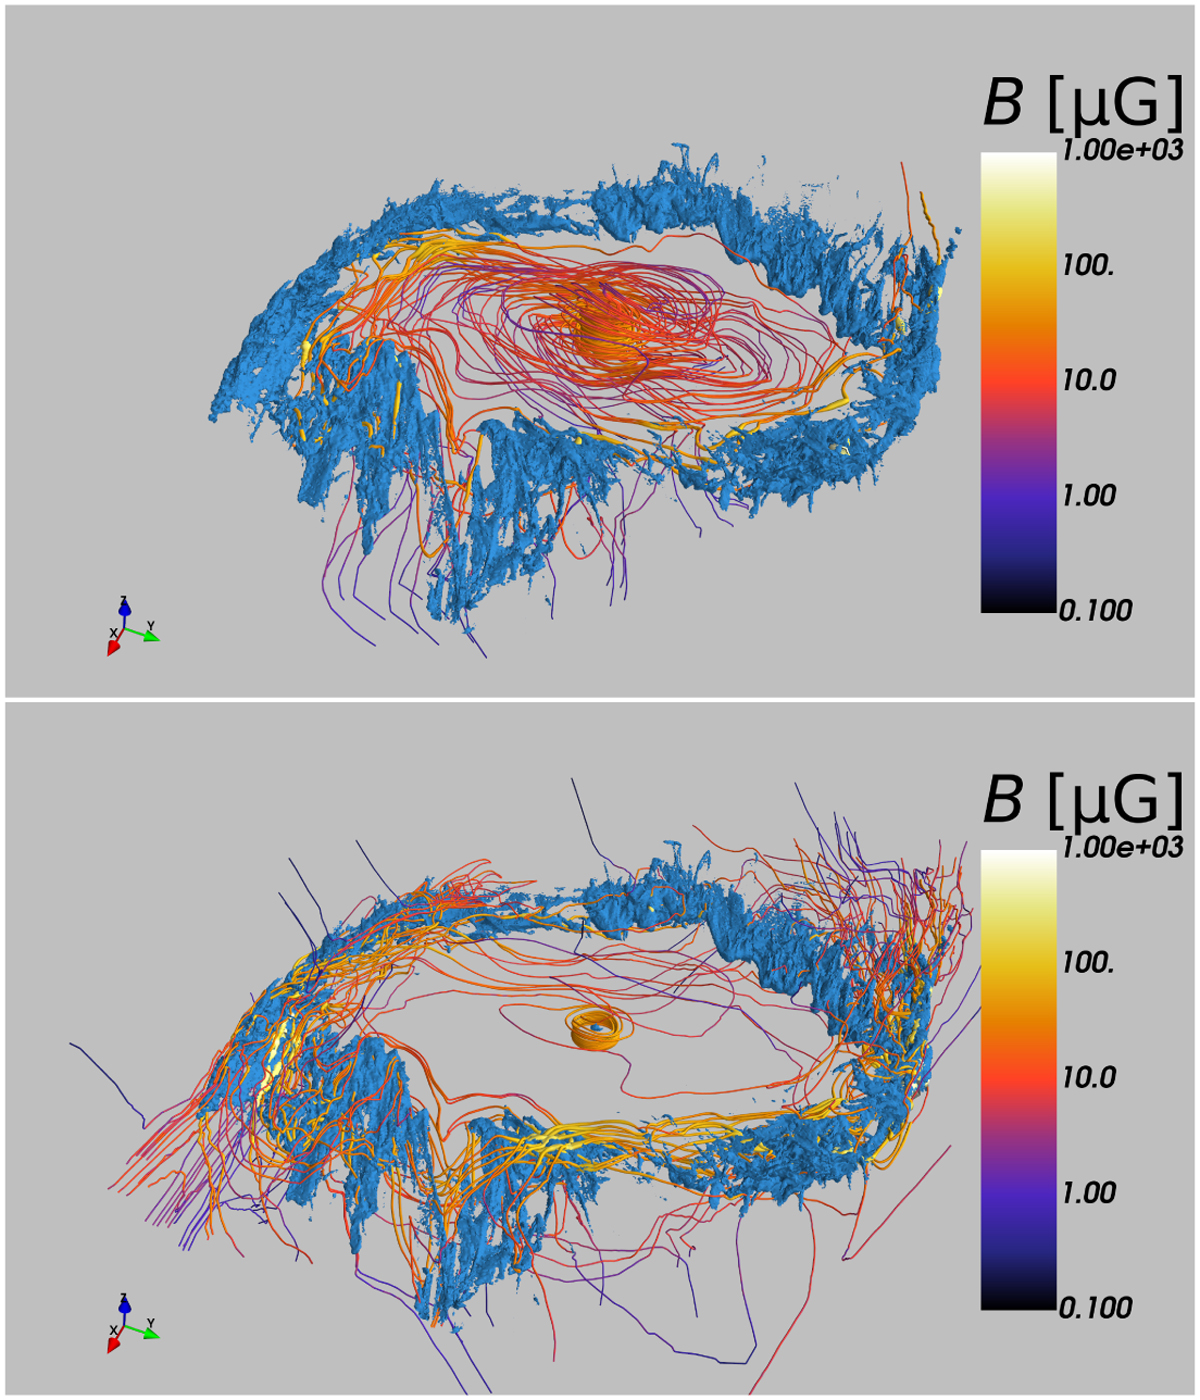
3D visualisation of the magnetic field lines in our fiducial CHEM_MHD simulation at t = 176 Myr. The field lines are constructed by starting at a given set of points, and following the field lines until they close on themselves or leave the domain to go to infinity (field lines cannot ‘end’ within the domain because ∇ ⋅ B = 0, i.e. they behave like velocity streamlines in an incompressible flow). In the top panel we use a set of starting points distributed on a hexagonal prism centred on the Galactic centre and whose faces are located inside the gas ring, roughly midway between the centre and the CMZ gas ring. In the bottom panel we use a set of starting points located near the end of the ‘bar lanes’, just outside the CMZ ring. The blue solid surface represents an isodensity surface at n = 100 cm−3.
Current usage metrics show cumulative count of Article Views (full-text article views including HTML views, PDF and ePub downloads, according to the available data) and Abstracts Views on Vision4Press platform.
Data correspond to usage on the plateform after 2015. The current usage metrics is available 48-96 hours after online publication and is updated daily on week days.
Initial download of the metrics may take a while.