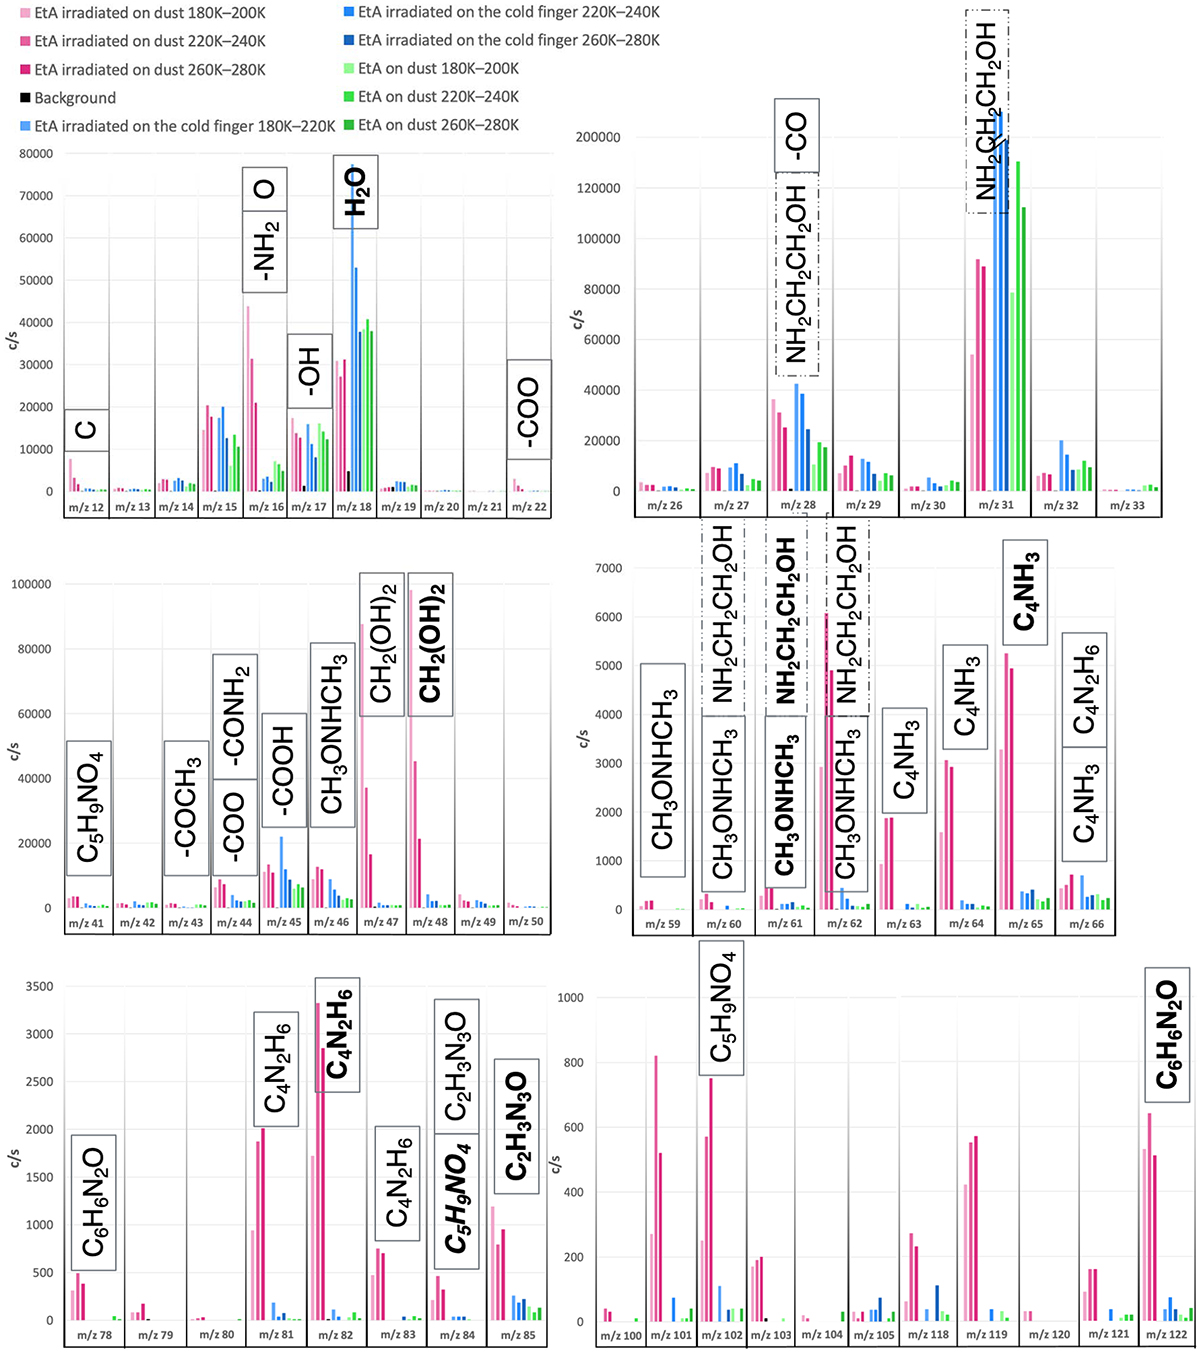
Fig. 5.
Download original image
Mass spectra comparison in three different temperature ranges: lighter shades refer to T = 180 K–200 K, medium ones to T = 220 K–240 K and darker ones to T = 260 K–280 K. Magenta shades represent ethanolamine irradiated with UV light onto the olivine dust substrate, blue ones are for ethanolamine irradiated on the clean cold finger, and green ones for ethanolamine desorbed from the olivine dust without the UV irradiation. The background, in black, is almost always negligible. Each peak has an indication of the species to which it is assigned: a formula preceded by a dash indicates a functional group (e.g., –OH); a bold formula indicates a molecular species in the m/z value associated with its molecular mass (e.g., H2O is bold in correspondence to m/z 18); a bold italics formula indicates a molecular species in correspondence to its main fragment m/z value (used only when the species has a molecular mass which does not appear in the zooms); ethanolamine is highlighted by a dashed box; all other formulae, in capital block letters, indicate the molecular species that can contribute to the peak.
Current usage metrics show cumulative count of Article Views (full-text article views including HTML views, PDF and ePub downloads, according to the available data) and Abstracts Views on Vision4Press platform.
Data correspond to usage on the plateform after 2015. The current usage metrics is available 48-96 hours after online publication and is updated daily on week days.
Initial download of the metrics may take a while.