Open Access
Fig. 3
Download original image
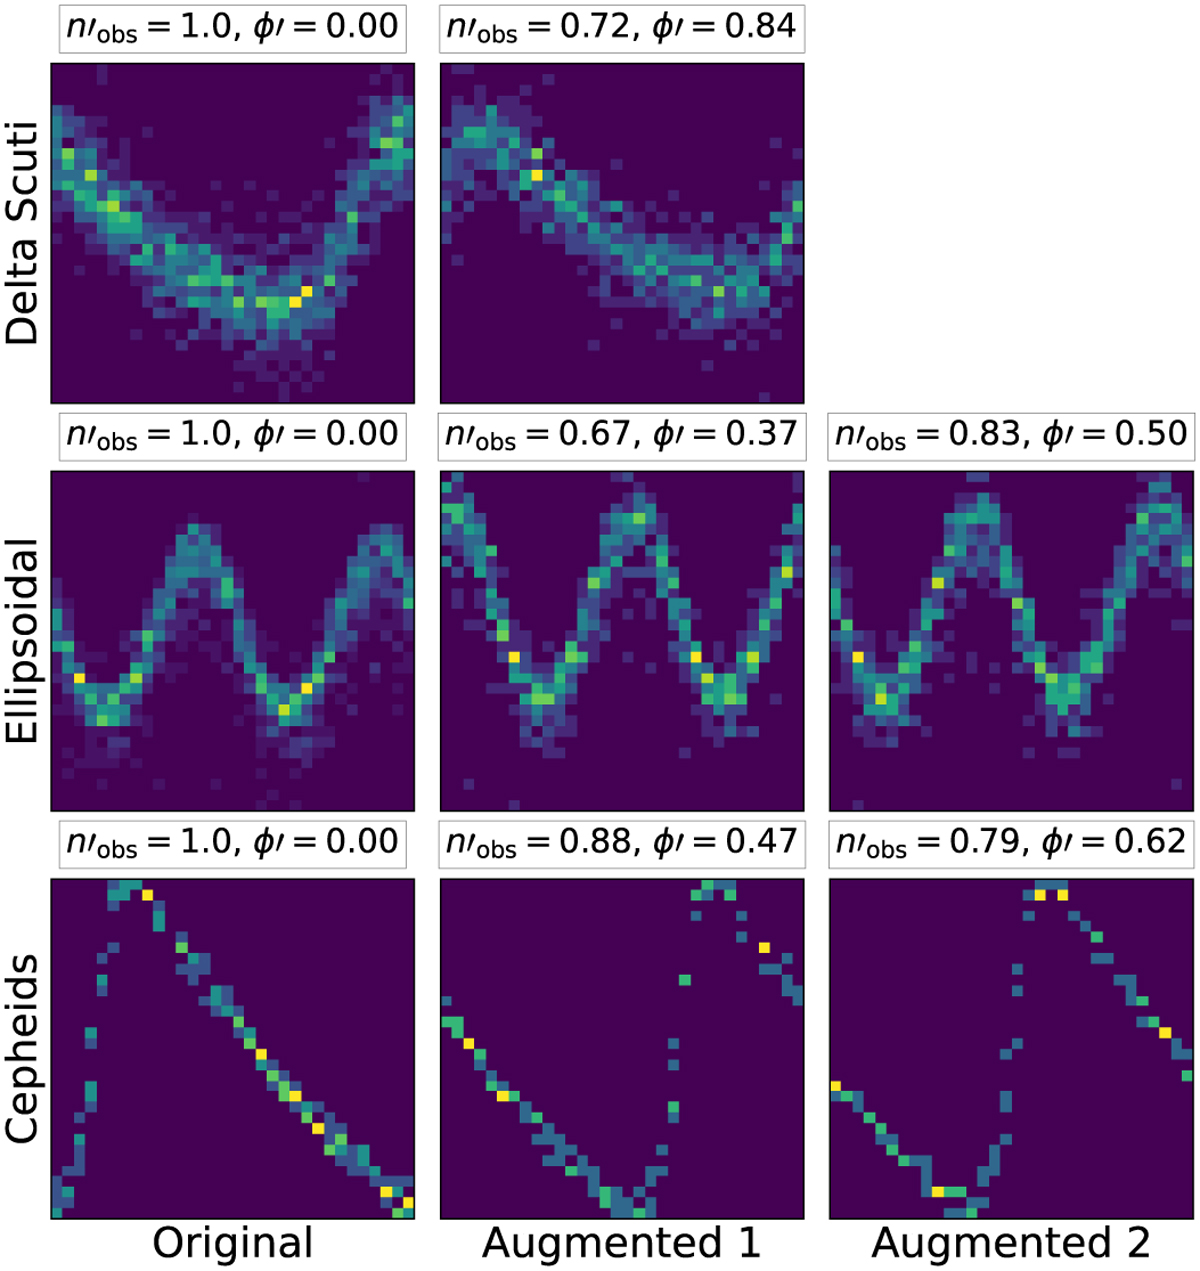
Examples of DA for CEP, DST, and ELL are shown. The first column represents the original LC, while the other columns represent different modifications of the LC. At the top of each image, we display the fraction of the total number of observation ![]() , and the offset in phase (ϕ′).
, and the offset in phase (ϕ′).
Current usage metrics show cumulative count of Article Views (full-text article views including HTML views, PDF and ePub downloads, according to the available data) and Abstracts Views on Vision4Press platform.
Data correspond to usage on the plateform after 2015. The current usage metrics is available 48-96 hours after online publication and is updated daily on week days.
Initial download of the metrics may take a while.