Fig. 2
Download original image
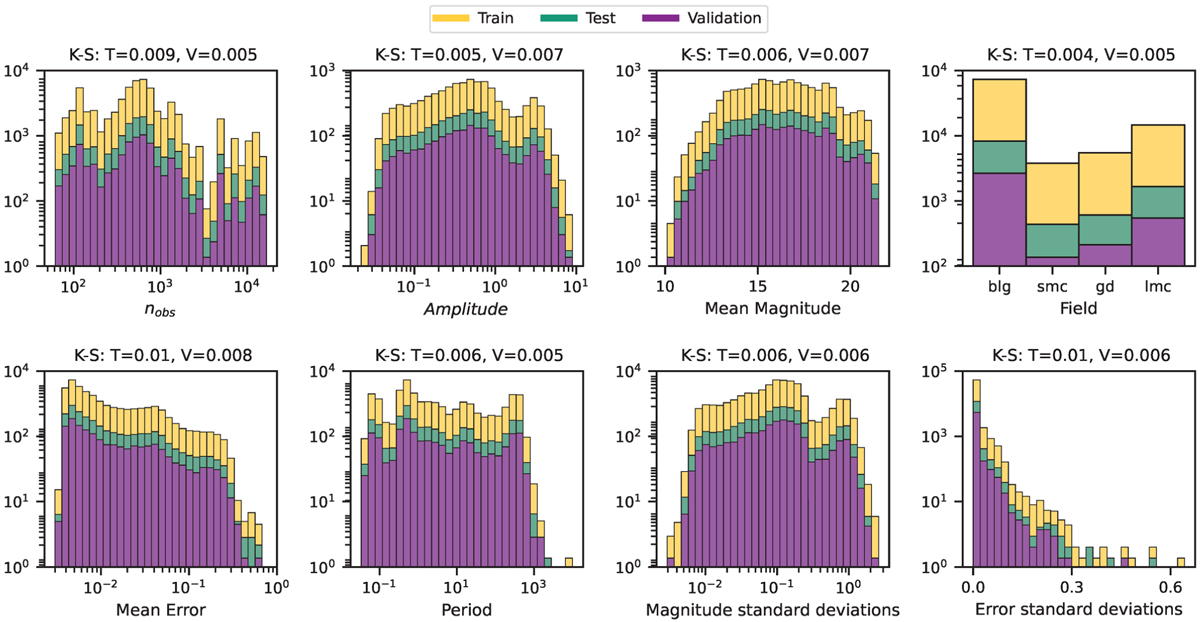
Distribution of observational parameters of the variable stars used in this work is shown. The number of observations, amplitude, mean magnitude, field, mean error, period, magnitude standard deviation, and the standard deviation of magnitude error are presented. The yellow, purple, and green colors represent the training, validation, and testing sets, respectively. The distributions are stacked for better visualization, and the titles correspond to the K-S test for validation and testing.
Current usage metrics show cumulative count of Article Views (full-text article views including HTML views, PDF and ePub downloads, according to the available data) and Abstracts Views on Vision4Press platform.
Data correspond to usage on the plateform after 2015. The current usage metrics is available 48-96 hours after online publication and is updated daily on week days.
Initial download of the metrics may take a while.