Fig. 1
Download original image
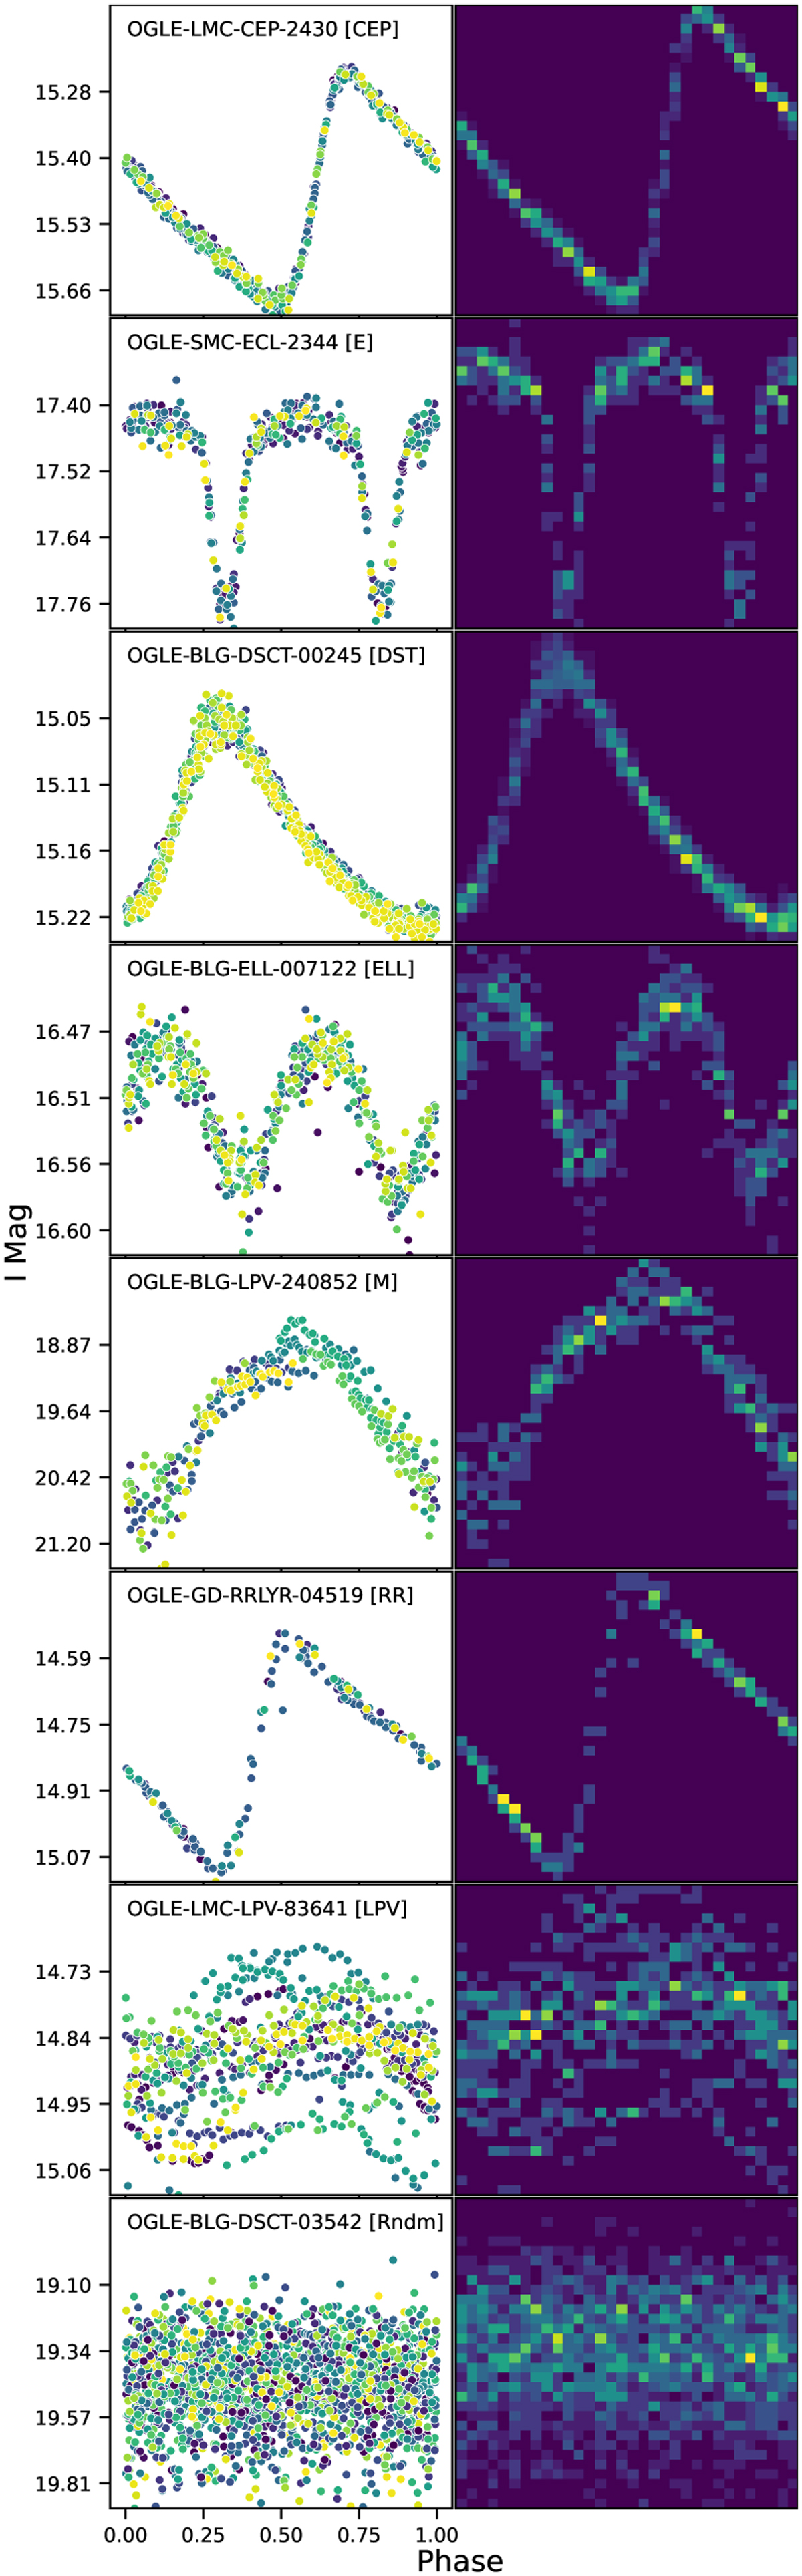
Phase LCs for the different variability classes considered in the OGLE sample. For each class, the first column shows the lightcurve with colors showing the different cycles. From the top the different variability classes are M, CEP, ELL, E, DST, RR, LPV, and the Random period Class. The second columns are the 32 × 32 histogram and the color represent the number of observation in each bin with a min-max normalization.
Current usage metrics show cumulative count of Article Views (full-text article views including HTML views, PDF and ePub downloads, according to the available data) and Abstracts Views on Vision4Press platform.
Data correspond to usage on the plateform after 2015. The current usage metrics is available 48-96 hours after online publication and is updated daily on week days.
Initial download of the metrics may take a while.