Fig. 8.
Download original image
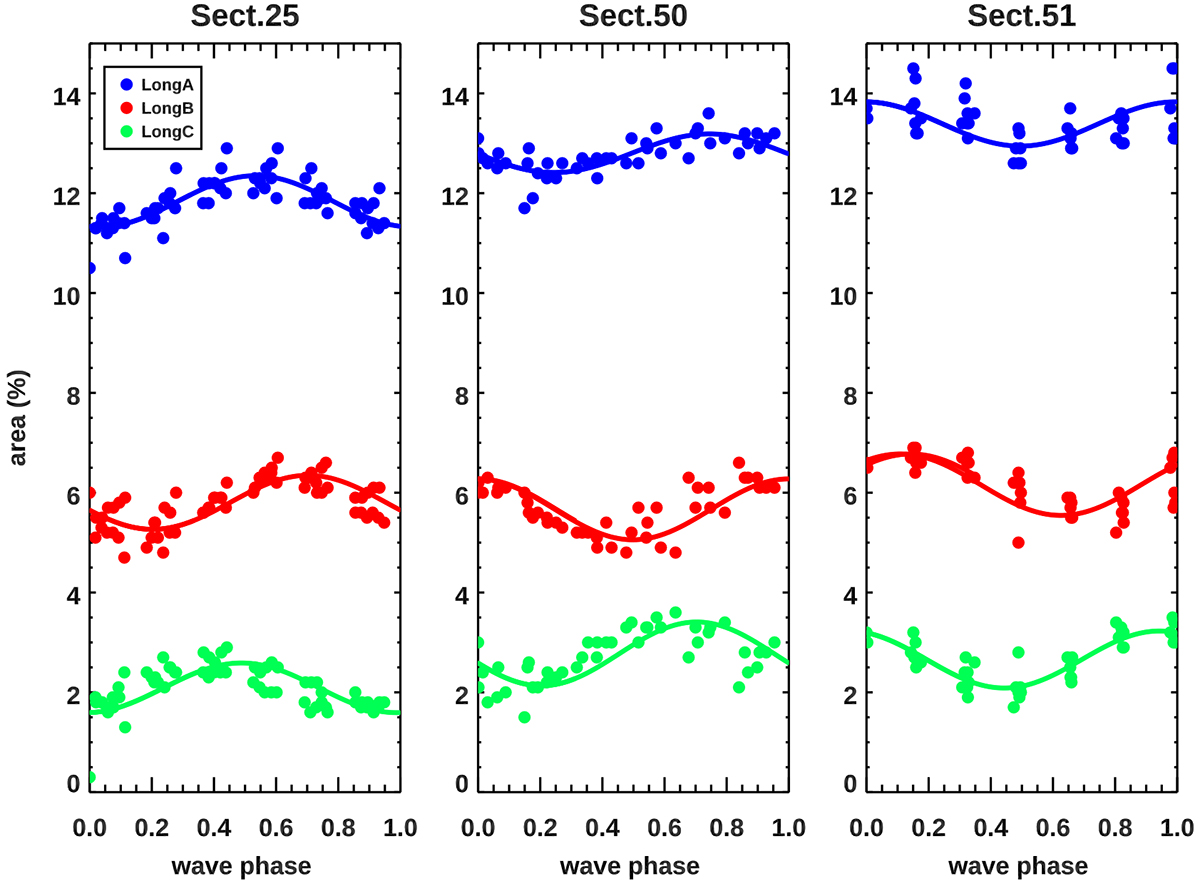
Spot area at each active longitude vs the phase of the presumed Rieger cycle, whereby phases were computed using the area modulation period, P = 2.25 d. It is evident that spots A and B share the highest activity level, whereas spot C has marginal activity. The area modulation of spots A and B is in opposition, with activity at maximum in one longitude when at minimum in the opposite longitude.
Current usage metrics show cumulative count of Article Views (full-text article views including HTML views, PDF and ePub downloads, according to the available data) and Abstracts Views on Vision4Press platform.
Data correspond to usage on the plateform after 2015. The current usage metrics is available 48-96 hours after online publication and is updated daily on week days.
Initial download of the metrics may take a while.