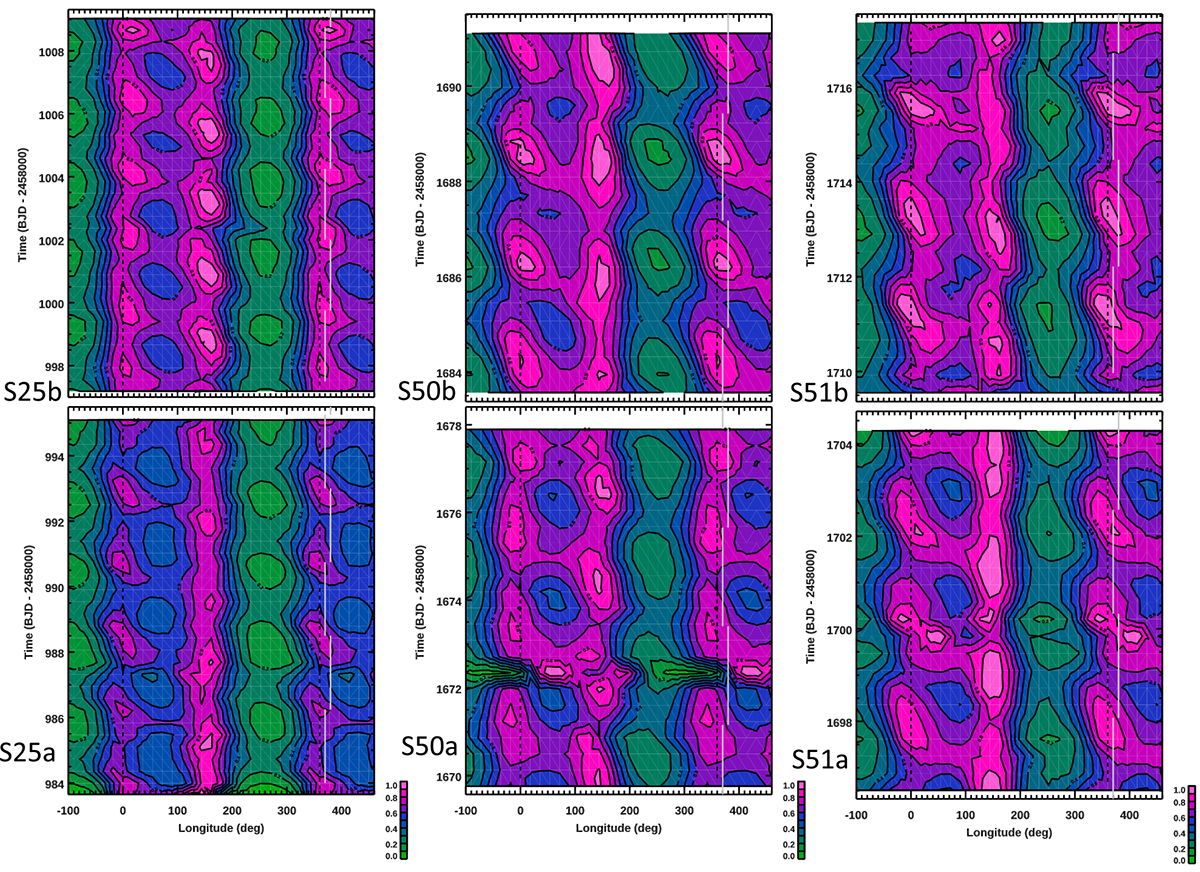
Fig. 7.
Download original image
Distribution of the spot filling factor vs the longitude and time derived by our maximum-entropy spot model of the TESS light curves in Sectors 20, 50, and 51. The maximum of the filling factor is indicated by the purple colour and the minimum by dark blue (see colour scale in the lower right corners). We note that the longitude scale is repeated beyond the [0°, 360°] interval to better follow the migration of the spot features. Each TESS sector is split into two intervals to skip the data gap. The solid white lines help one to track the spot evolution from one active longitude to the other.
Current usage metrics show cumulative count of Article Views (full-text article views including HTML views, PDF and ePub downloads, according to the available data) and Abstracts Views on Vision4Press platform.
Data correspond to usage on the plateform after 2015. The current usage metrics is available 48-96 hours after online publication and is updated daily on week days.
Initial download of the metrics may take a while.