Open Access
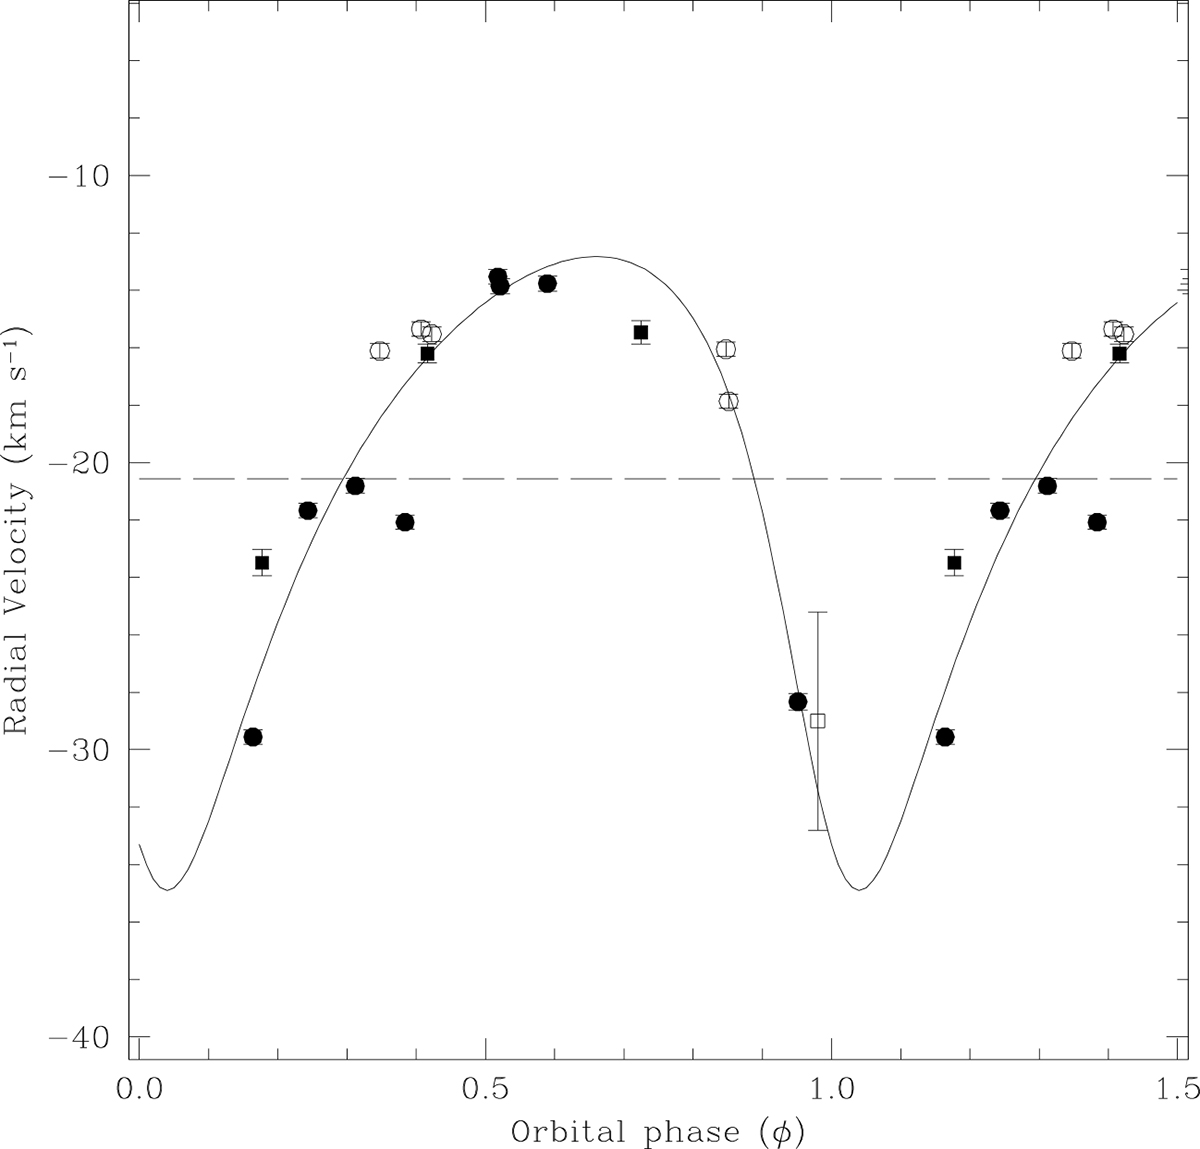
Fig. 5.
Download original image
Radial velocity curve for our target. The black dots represent RVs from FIES/NOT and the black squares ones from ESPADONS/CFHT. The error bars are as large as three σ. The literature value from Binks & Jeffries (2016) is plotted as an open square, and those from Jönsson et al. (2020) as open circles.
Current usage metrics show cumulative count of Article Views (full-text article views including HTML views, PDF and ePub downloads, according to the available data) and Abstracts Views on Vision4Press platform.
Data correspond to usage on the plateform after 2015. The current usage metrics is available 48-96 hours after online publication and is updated daily on week days.
Initial download of the metrics may take a while.