Open Access
Fig. B.1.
Download original image
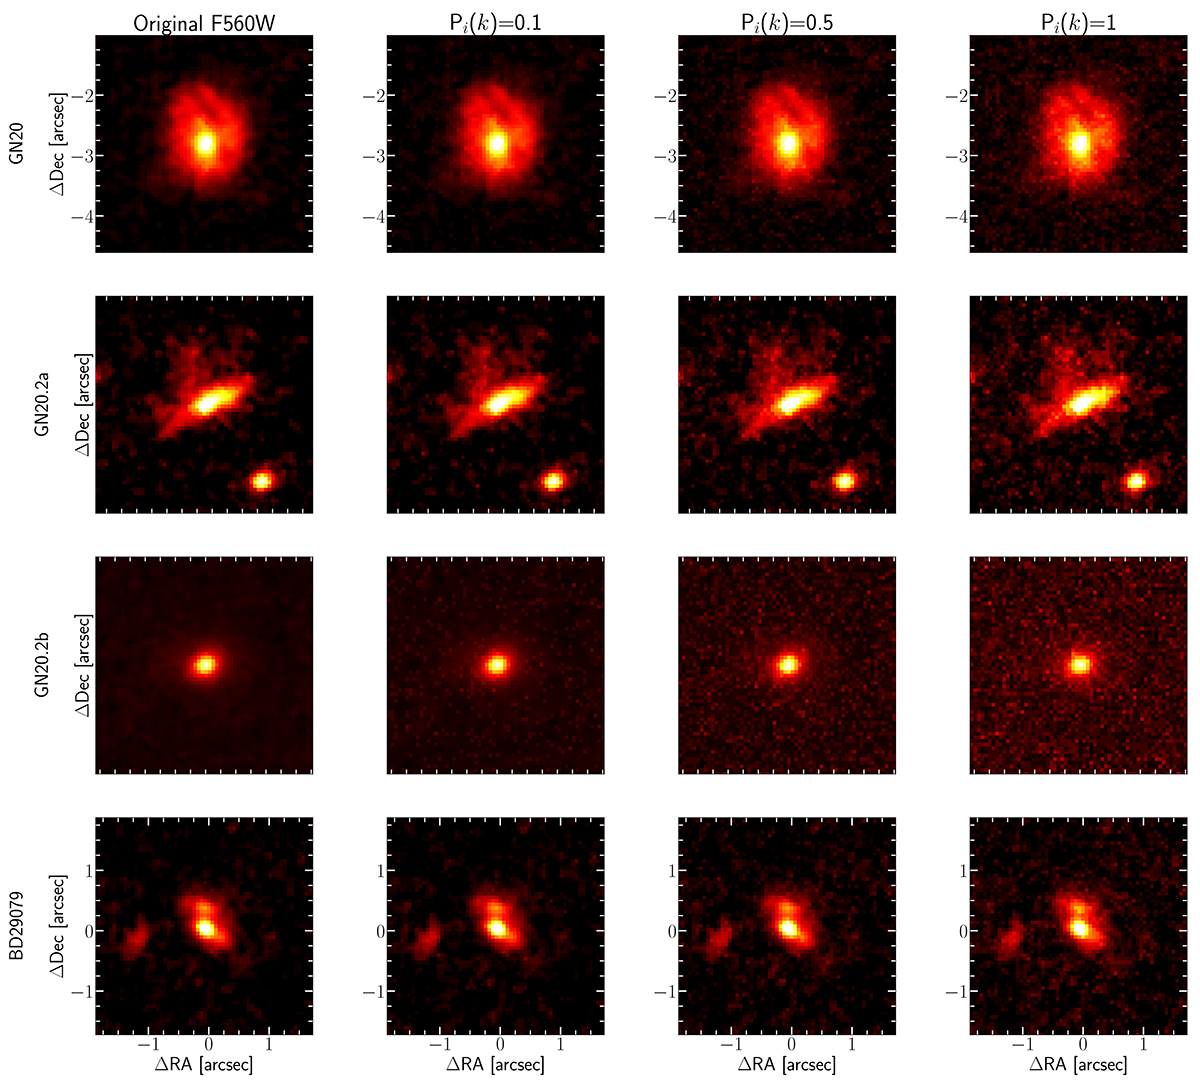
Comparison of the original data (left column) and the Poisson noise added versions that are classified by the related variance Pi(k). Lower values of Pi(k) are associated with less noise. The variance of the input data is listed in Table B.1.
Current usage metrics show cumulative count of Article Views (full-text article views including HTML views, PDF and ePub downloads, according to the available data) and Abstracts Views on Vision4Press platform.
Data correspond to usage on the plateform after 2015. The current usage metrics is available 48-96 hours after online publication and is updated daily on week days.
Initial download of the metrics may take a while.