Fig. 6.
Download original image
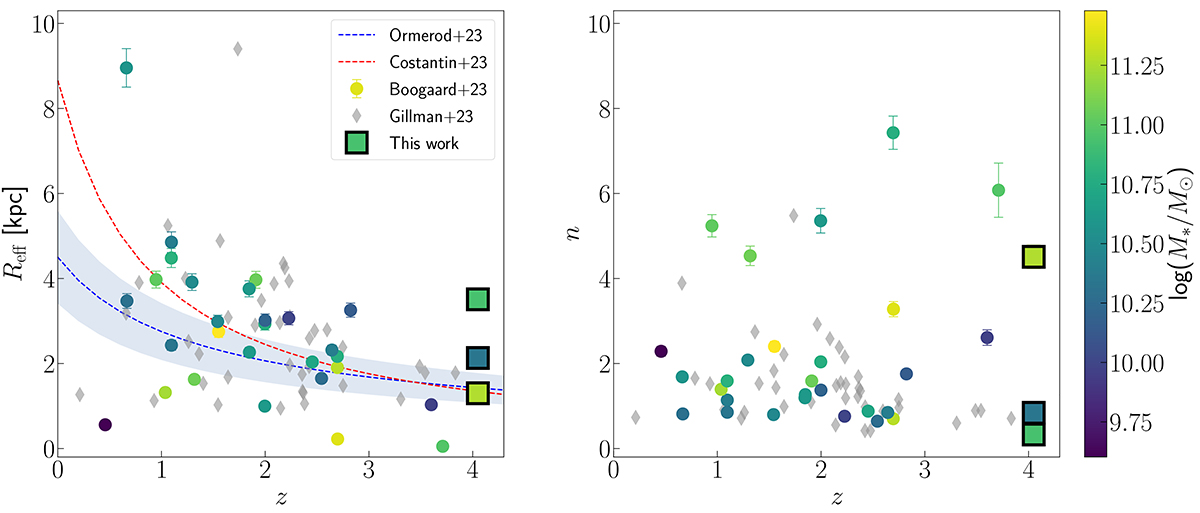
Evolution of morphology with redshift. This figure shows the evolution with redshift for the effective radii (left panel) and Sérsic index (right panel) for the sample of ALMA-selected galaxies presented in Boogaard et al. (2024). Black-edged squares display the position of our DSFGs in these panels. Each point is colour-coded according to its stellar mass. Red dashed line in the left panel represents the trend found in Costantin et al. (2023) for CEERS F356W mock images produced from TNG50 simulations. The blue line and shadow show the best-fit and its associated uncertainty derived for a sample of CEERS+CANDELS galaxies by Ormerod et al. (2024). Grey diamonds display the sample of SMGs at z < 5 presented by Gillman et al. (2023).
Current usage metrics show cumulative count of Article Views (full-text article views including HTML views, PDF and ePub downloads, according to the available data) and Abstracts Views on Vision4Press platform.
Data correspond to usage on the plateform after 2015. The current usage metrics is available 48-96 hours after online publication and is updated daily on week days.
Initial download of the metrics may take a while.