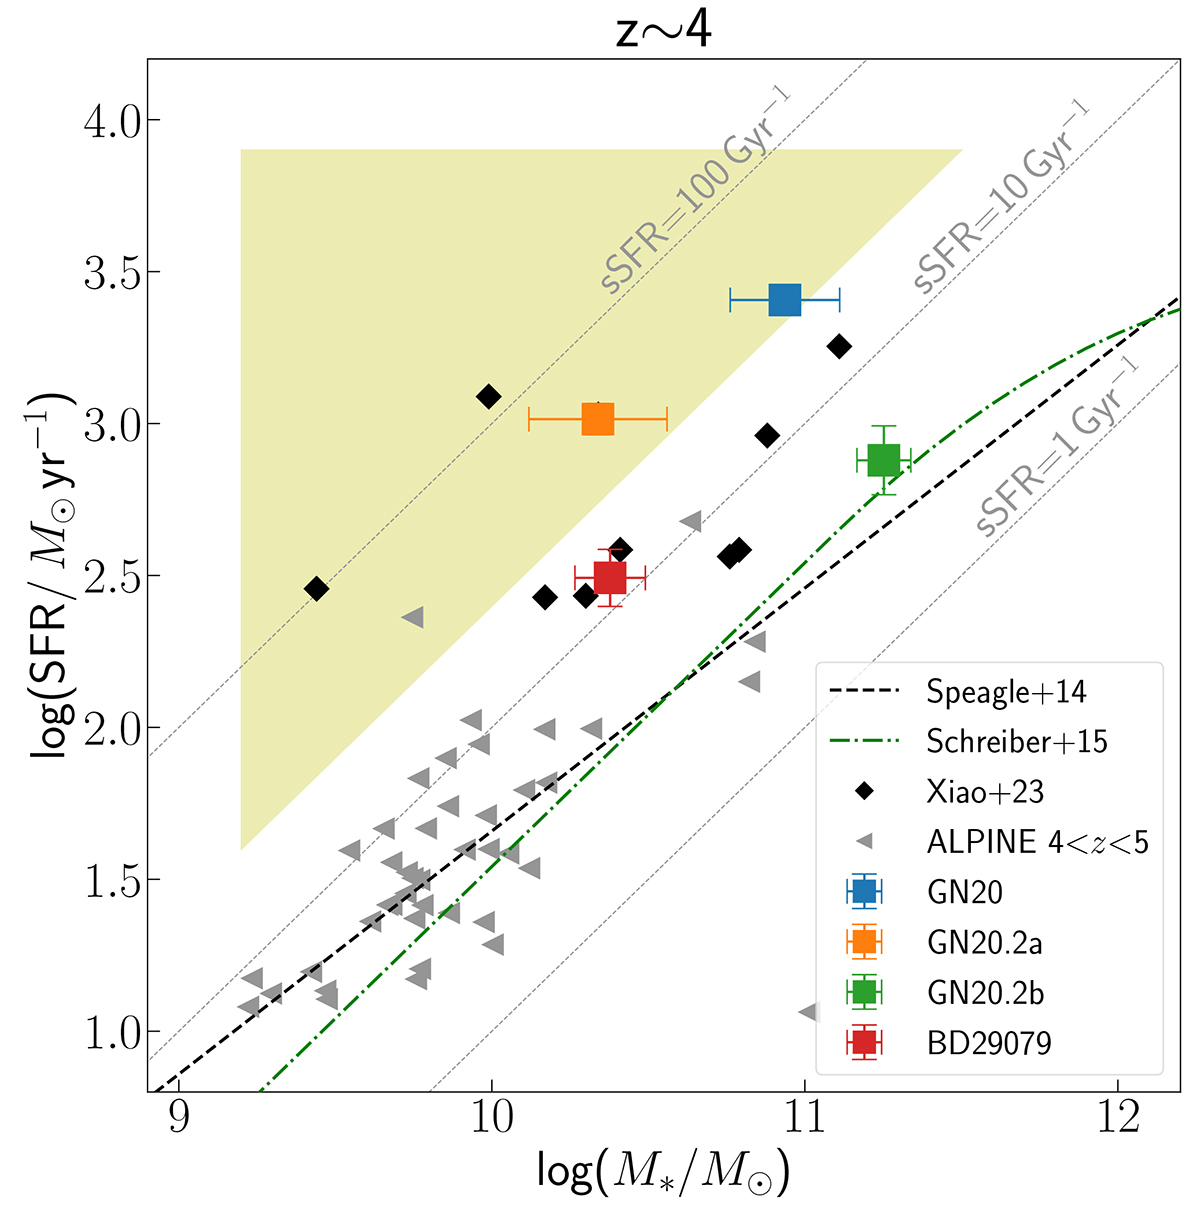
Fig. 5.
Download original image
SFR versus stellar mass plane. The panel shows the galaxies studied in this work, as squares, along with the ALPINE sample at similar redshift (Faisst et al. 2020), as grey triangles, and the sample of OFGs from Xiao et al. (2023), as black diamonds. Black dashed and green dot-dashed lines represent the SFMS at z = 4 following Speagle et al. (2014) and Schreiber et al. (2015), respectively. Yellow shadow area represents the starburst region defined by Caputi et al. (2017).
Current usage metrics show cumulative count of Article Views (full-text article views including HTML views, PDF and ePub downloads, according to the available data) and Abstracts Views on Vision4Press platform.
Data correspond to usage on the plateform after 2015. The current usage metrics is available 48-96 hours after online publication and is updated daily on week days.
Initial download of the metrics may take a while.