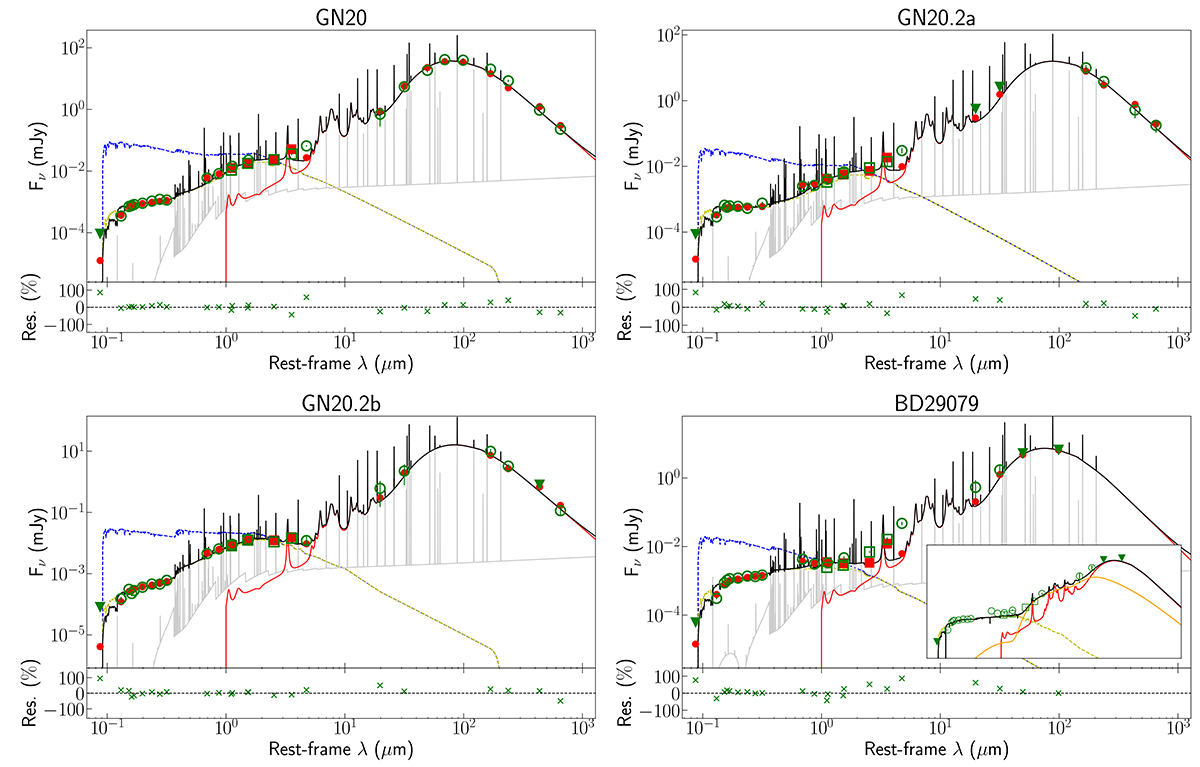
Fig. 4.
Download original image
Rest-frame UV to millimetre (mm) SEDs and best-fit model derived with CIGALE for the objects in the sample. Green open circles and triangles show the observed fluxes and upper-limits as presented in Table A.1, while the MIRI photometric measurements are marked as green open-squares. Lines represent the stellar (unattenuated in dashed blue and attenuated in dashed yellow), nebular (solid grey), and dust (in solid red) contribution to the total SED (in black). Red circles display the modelled fluxes in every filter considered during the SED fitting. Each panel shows, at the bottom, the relative residuals derived from the measured photometry and the CIGALE results. Orange solid line in the inset displays the AGN contribution considered for BD29079 (see Sect. 4.3). In this inset, the nebular contribution is not plotted for simplicity.
Current usage metrics show cumulative count of Article Views (full-text article views including HTML views, PDF and ePub downloads, according to the available data) and Abstracts Views on Vision4Press platform.
Data correspond to usage on the plateform after 2015. The current usage metrics is available 48-96 hours after online publication and is updated daily on week days.
Initial download of the metrics may take a while.