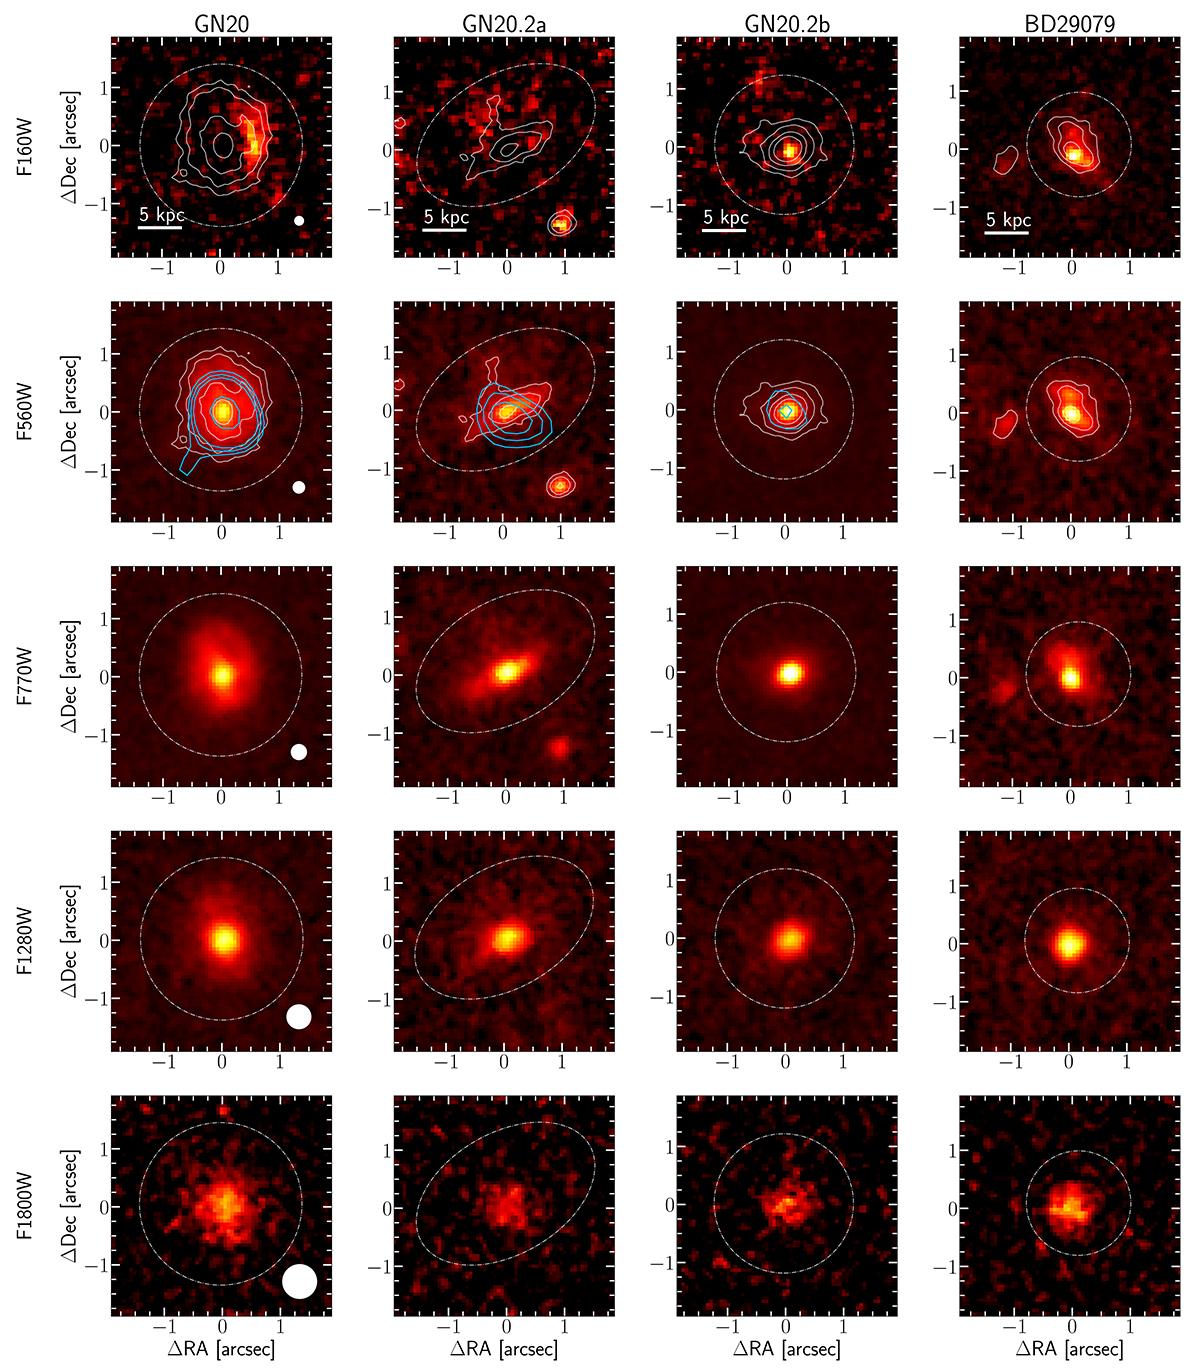
Fig. 1.
Download original image
Rest-frame UV and near-IR for the galaxies in the sample. From top to bottom: HST/F160W, MIRI/F560W, MIRI/F770W, MIRI/F1280W, and MIRI/F1800W images for the three DSFGs and the LBG at z = 4.05, tracing the rest-frame ∼0.3 μm, 1.1 μm, 1.5 μm, 2.5 μm, and 3.5 μm emission, respectively. White contours represent the F560W isophotes at 5σ, 10σ, 20σ, and 35σ levels, where σ is the standard deviation of the background emission of each image. Dashed-line circles and ellipses represent the apertures used to extract the integrated flux for each object. Filled white circles at the lower right corner of the left-most panels show the PSF size for each image. The (0,0) positions mark the brightest pixel in the F560W image for each object. Blue contours in the second-row panels display the PdBI CO(6-5) emission for the DSFGs presented in Carilli et al. (2010) and Hodge et al. (2013).
Current usage metrics show cumulative count of Article Views (full-text article views including HTML views, PDF and ePub downloads, according to the available data) and Abstracts Views on Vision4Press platform.
Data correspond to usage on the plateform after 2015. The current usage metrics is available 48-96 hours after online publication and is updated daily on week days.
Initial download of the metrics may take a while.