Fig. 4.
Download original image
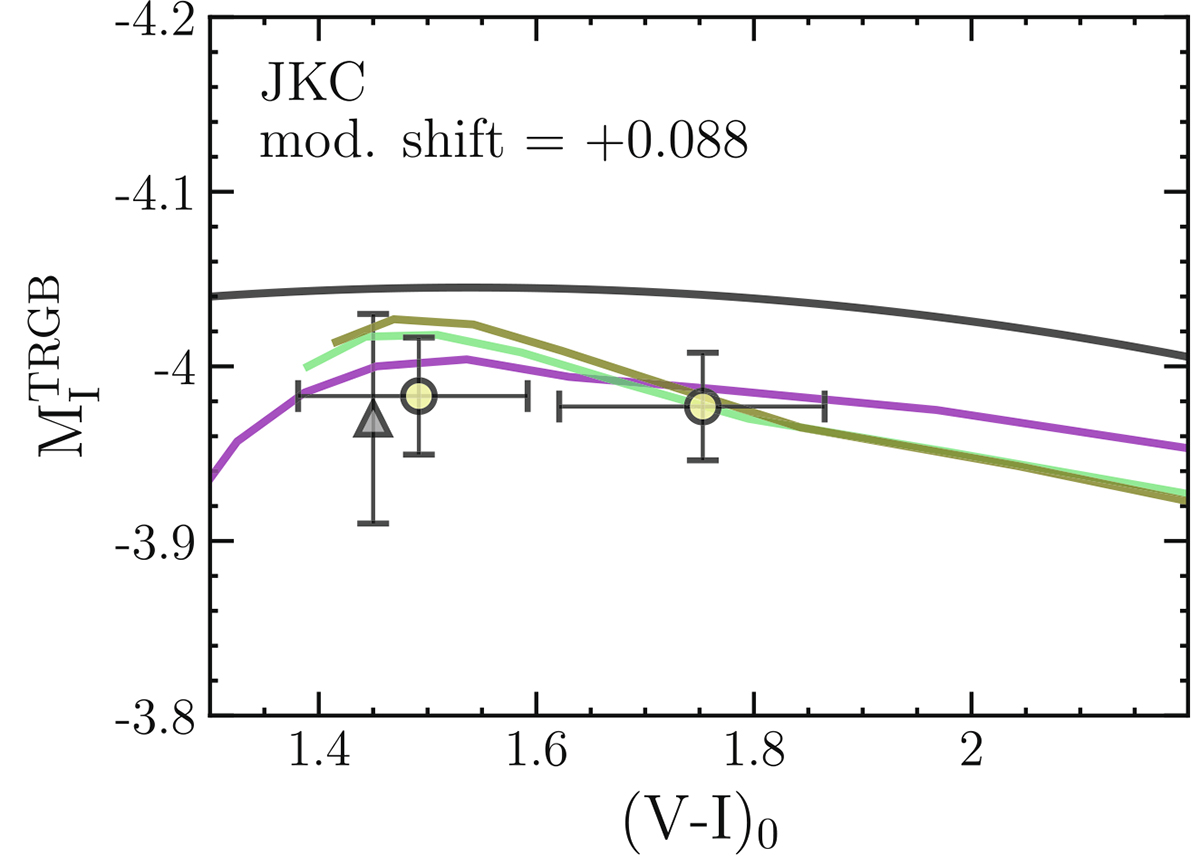
I-band absolute magnitude of the RGB tip as a function of V-I colour. The calibration of our measurements in the SMC and LMC are plotted as yellow filled circles with vertical error-bar at 1σ confidence intervals and horizontal error-bars at 1σ confidence interval. In all cases, the point corresponding to the SMC has a bluer colour (here (V-I)0) than the one corresponding to the LMC. The grey triangle is the calibration obtained by Soltis et al. (2021) in ω Cen. The black curve is the calibration provided by H23 in form of a second order polynomial fit. The coloured curves are model predictions obtained from the set of Padua isochrones by Bressan et al. (2012), corresponding to ages of 4 Gyr (purple line), 10 Gyr (light blue), and 13 Gyr (green line), all vertically shifted by the amount reported in the plot (mod. shift). The shift is applied to make the 10 Gyr model, taken as reference, to match the point corresponding to the LMC.
Current usage metrics show cumulative count of Article Views (full-text article views including HTML views, PDF and ePub downloads, according to the available data) and Abstracts Views on Vision4Press platform.
Data correspond to usage on the plateform after 2015. The current usage metrics is available 48-96 hours after online publication and is updated daily on week days.
Initial download of the metrics may take a while.