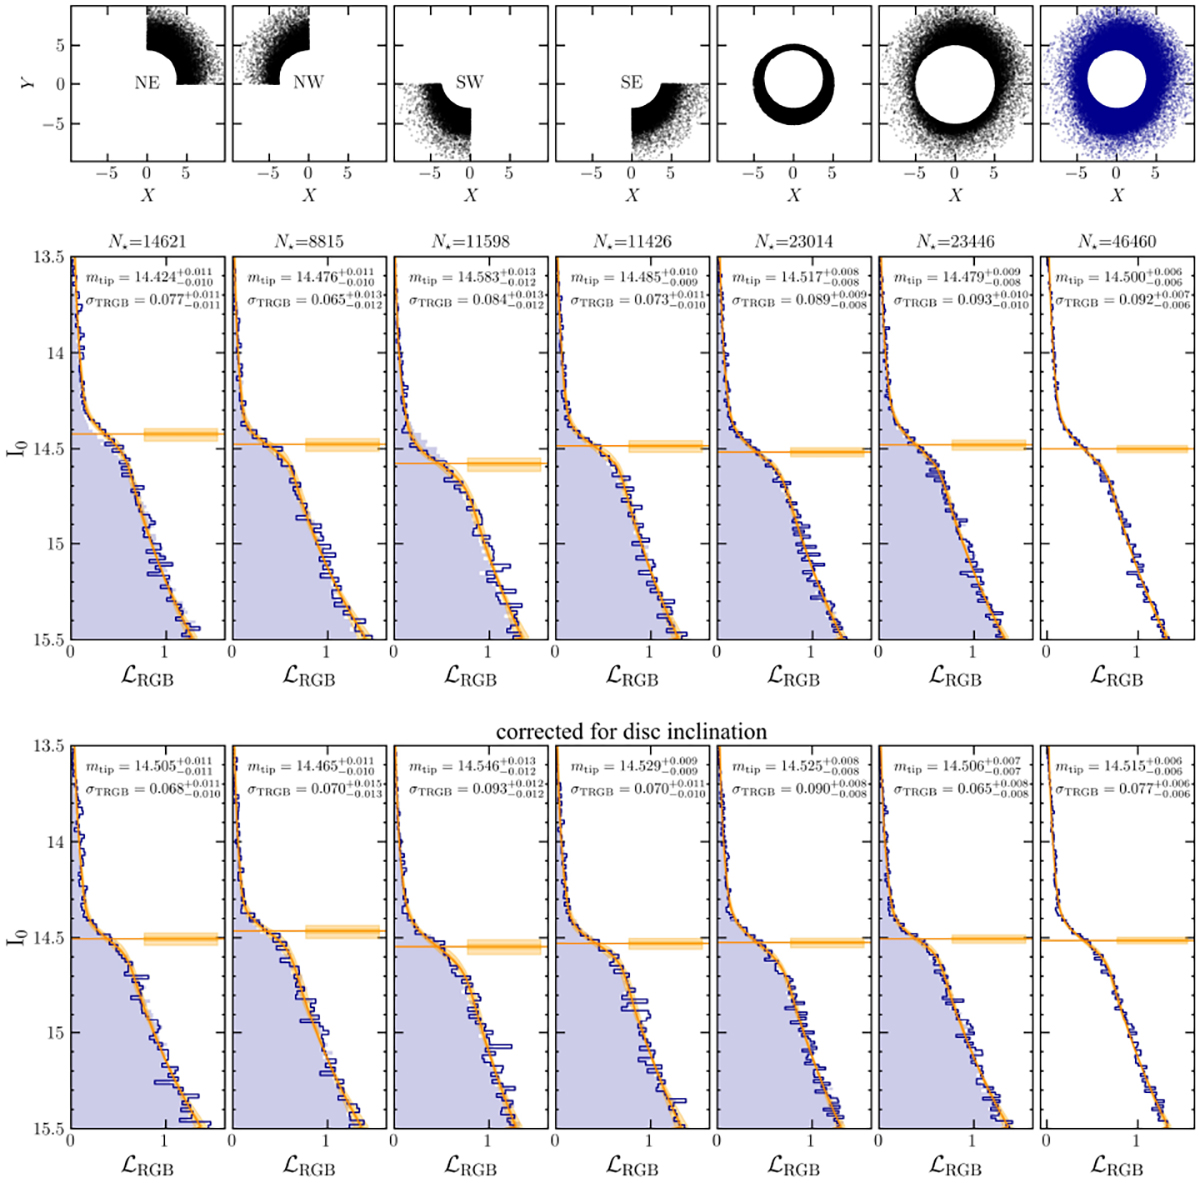
Fig. C.1.
Download original image
Upper row of panels: maps of the stars in the different subsamples of the LMC samples used for the RGB Tip detections shown in the lower panels. The inclination of the LMC disc is such that the NE side is the closest to us and the SW side is the farthest. Middle row of panels: Detection of the RGB Tip in different quadrants (four leftmost panels) and different radial zones (fifth and sixth panels from the left) of the LMC sample. In the eighth panel the detection on the entire sample is shown. Lower row of panels: the same as in the middle raw but after applying the correction for the 3d geometry of the LMC.
Current usage metrics show cumulative count of Article Views (full-text article views including HTML views, PDF and ePub downloads, according to the available data) and Abstracts Views on Vision4Press platform.
Data correspond to usage on the plateform after 2015. The current usage metrics is available 48-96 hours after online publication and is updated daily on week days.
Initial download of the metrics may take a while.